Pages

Saturday, April 30, 2016

Mexico Oil and Gas Production Declines Continue in March

Pemex reported March production this week, confirming that ongoing promises of a recovery in output are still unrealized.  Liquids (85% oil, 15% NGL) were down to their lowest level ever, and natural gas output logged a sixth month of sharp declines, down almost 1/2 a BCFD since September.  This corresponds with increased imports from the US over the same period.  


Monday, April 25, 2016

Limits to U.S. Gas-fired Electricity Generation

Natural gas was heavily bid in April, after falling to $1.84 in late March.  Today's close at $2.06 is still within the coal-switching price range, though the forward curve is in steep contango, rising to about $2.70 for the November contract.

There seems to be excitement around two major price drivers:  (1) plateau/decline in domestic production, and (2) the march toward LNG exports, which have commenced and are running about 0.5 to 0.6 BCFD at present.  However, unless we soon see a notable decrease in production from current levels, the hope for further increases will have to come from weather and economic recovery.  The US economy is growing too slowly to generate the kind of power demand growth we have seen in earlier recoveries, and many ISOs are forecasting 1% or lower annual demand growth.

I would contend that the power generation market has the potential to disappoint gas bulls.   Acknowledging that there will be further gains from coal plant closures, the fact remains that coal switching is the source of so much current demand that a return to the $3 price range for Henry Hub would quickly offset that.

The other problem, and it is a big one, is the rise of renewables.  We are in an environment where power demand growth is hard to detect.  And total US daily demand averages somewhere near 11,000 GWH:


If power demand is growing nationally at 0-1%, that's an increase of between zero and 110 GWHD.  With that in mind, the expected new installs of solar and wind this year, adjusted for their anticipated capacity factors, only need to exceed that number in order for the hydrocarbon-based power market to shrink.  Here are the monthly historicals for those two power sources:


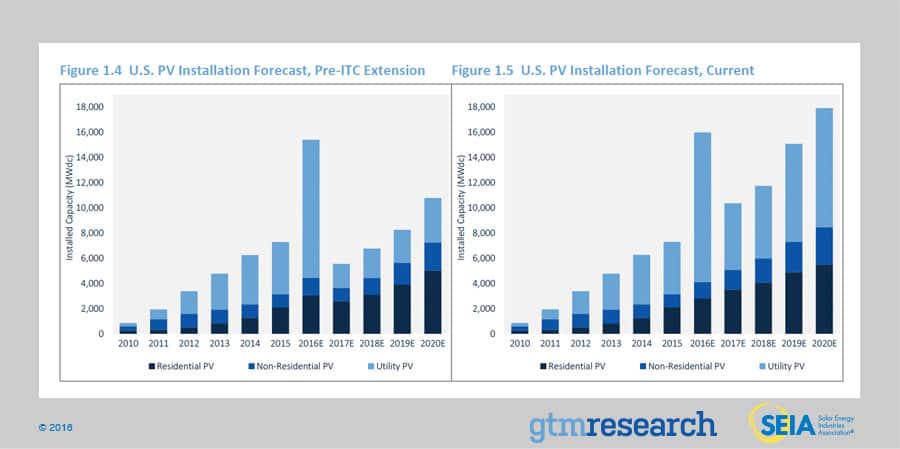
Solar power alone, the runt of the renewable litter, is slated to see 16 GW of new capacity in '16 (including distributed power and utility scale).  If that had a 30% capacity factor, it would mean a 115 GWHD increase in generation!  And solar is just a shadow of wind (heh, sorry, who can resist cheap irony?).  Texas alone will install 8 GW of wind in 2016, and that has historically been at a 35% cap fac.  So there is no room at the inn for carbon-based generation growth, unless we see economic growth, or a migration to electric cars, on a scale that nobody is forecasting at this time.

Can gas go to $3? Absolutely.  But barring persistent abnormal weather, the glass ceiling is at $3 or below.  The 2 year decline in rig count has some licking their chops over production declines, but the uncompleted well inventory and the drilling efficiency of the few working rigs will address any shortfalls.  And at $3, there are enough economic drill sites that we should see a rapid return of the rig fleet, albeit at much lower drilling and fracking day rates.


Sunday, April 17, 2016

Renewable Fuels Threaten Natural Gas Demand in 2016

With a multiyear extension of the tax credit for solar and wind power generation, the forecast for capacity additions now dwarfs the forecast for power demand growth.  Gas fired generation is the natural victim of this trend, and the rate at which solar and wind installation costs are falling has insulated many projects from the collapse in gas prices this year.

A look at the ERCOT region of Texas (85% of TX power market) highlights this.  While Texas has not added a meaningful amount of solar, it continues to lead in wind.  It ended 2015 with 16.2 GW of installed capacity, and expects to add 7.9 GW in 2016, that's almost a 50% increase in a power source that averaged a 35% capacity factor in 2015.  2016 will also be the first year of significant utility-scale solar installations, at 2.1 GW.

Consider that ERCOT projects just a 1.3%  CAGR in total power demand through the decade:


On an annualized basis, a 7.9 GW wind capacity addition, at a 35% CF, would add 24 Twh of generation, which is half of the total demand growth expected over the next 10 years.  No amount of coal retirements can offset that, so natural gas has to lose this war.

Out west, it's a similar story for solar in California.  California accounts for the great majority of solar power capacity in the US, and it will be the largest beneficiary of the nearly 12GW in new utility scale solar installations expected in 2016.


Solar threatens gas generation three ways....it's happening during peak A/C demand periods, it is predictable, and it would pair well with battery storage, if the storage technology advances enough.  It is also getting cheaper, faster than other renewables.

Unfortunately, the backdrop for this cannibalization is a stagnant US power demand market, and the war on coal hasn't been enough to offset the losses, inasmuch as gas supply has grown so quickly that prices have accomplished the market share destruction for coal that the EPA was tasked with.  If gas prices were to rise much, there is still substantial market share that coal could recover, and the consequent rising power prices would make renewable energy investments more attractive.  And time is against hydrocarbons, with Moore's Law seemingly in effect for solar installation costs.

ERCOT prices have been abysmally low, and the consensus is for more of the same through this summer.