Pages

Showing posts with label California. Show all posts

Sunday, July 9, 2017

Western Hydropower Surplus Fading Quickly

The record snowfalls and subsequent runoff in the Pacific Northwest has led to massive electrical output this year, but the effect is wearing off suddenly and quickly.

In June, the surplus generation over 2016 was equivalent to about 1 BCFD of natural gas.  But June's average hydro output of 12.8 GW has fallen to 8.6 GW as of yesterday, and should generally decline further throughout the month.  


This should reduce exports to California, which would in turn increase thermal generation there.  Thermal output in CAISO has been badly lagging prior years up to now:


Monday, January 30, 2017

Northwest Hydropower Loses Output, No Longer Exceeding 2016

The Bonneville Power Administration reports declining hydro output over the last 11 days, falling to more than 2 GW below last year.  This is resulting in higher thermal generation and lower exports to California.  This difference is about equal to the excess hydro generation we have been seeing recently in California, so the net effect is about zero right now vs last year's hydro output.  This represents a significant change from early January, when both CAISO and BPA were reporting strong hydro power:

BPA Hydro output:

BPA thermal generation:


Sunday, January 22, 2017

California Hydro Power Breaking Records, near 100GWh Per Day, Almost 3X Last Year

The heavy rains are driving record output for hydro power in CAISO region, and building snowpacks for spring runoff potential.

The last two days have averaged about 4GW, while last year was near 1.4GW:


Thursday, January 5, 2017

Western US Hydro Power Generation: CA & WA Maintaining High Output in January

Hydro output remains strong in the Pacific Northwest, but it isn't exceeding last year by much in January.  Last year was also a high output year:


In California, where capacity is much lower, hydro output is about 1 GW above last year so far in January.  Thusfar it is averaging 2.54 GW, against last year's 1.42 GW for the full month of January:

Wednesday, December 28, 2016

Western US Hydro Power Generation Remains Above 2015, Offsets Natural Gas Demand

Continued strong precipitation in California and the Pacific Northwest is driving higher electricity output in the BPA and CAISO systems.

Bonneville Power is reporting average hydro output near 10 GW over the last week, that's about 2.5 GW more than the same period last year, which translates to more than 0.5 BCFE of gas equivalent per day.


In California, CAISO hydro output has averaged 2.23 GW this month so far, about 1 GW above last year's 1.25 average for December:

Monday, December 26, 2016

Hydropower Generation in Western US Strong and Getting Stronger

Heavy precipitation in the Pacific Northwest, and high river and reservoir levels in California, are driving hydroelectric generation at >3.5 GW above last year.  

In the Northwest, the Bonneville Power Admin reports daily averages of as much as 10.4 GW:


And in California, CAISO shows a week of increasing output, with the last two days averaging 2.73 GW, while last year same days were 1.43 GW:

Tuesday, July 29, 2014

Western US Hydro Power Outperforming Last Summer

Despite the drought conditions prevailing in the Southwest, a combination of low flows last year and better hydrological conditions in the Pac NW is resulting in higher electric generation than 2013.

California's daily hydro output is marginally below 2013:


Meanwhile the much more powerful Columbia river is driving higher output up north recently:


Tuesday, May 20, 2014

Western US Hydro Power Outlook

The seasonal outlook for western US hydropower output this summer is little changed.  Continued expectations for above average stream flow and generation from the northwest outweighs the lost output due to the drought in the Sierras, and the Colorado river basin is expecting runoff near normal though reservoir levels are well below normal:

Hydro output has been robust thus far in the Northwest:


And the streamflow outlook for the Columbia River is 108% of normal as of yesterday:


Meanwhile drought in the Sierras has snowpack at just 4% of normal for this date:


But California hydro output has not fallen much below last year so far.  But it should begin to decline soon, at a faster rate than last year.


And the snowpack graph for the Colorado river shows a near normal peak and a slightly earlier than normal melt off:


Tuesday, May 13, 2014

Hydro Power Forecasts Improve in the West

The Pacific Northwest, single largest source of the nation's hydropower, has seen a steadily improving streamflow forecast, which now sits at a season high 110.5% of normal.


Drought conditions persist in California, as is widely expected.  But California doesn't have nearly the hydro capacity of the Northwest.  Currently the snowpack in the Sierras sits at 12% of normal for this date.


Thursday, May 1, 2014

California Solar Generation Offsets Hydro Shortage

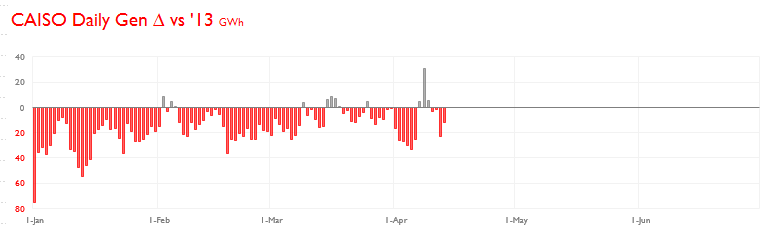
The well publicized hydro power shortage in California this year, owing to the historic drought, has reduced hydro power output by about 50% so far this year over last year (which was also lower than normal).  But so much new solar has been installed in California in the last 12 months, that the increase in solar output has nearly offset the losses in hydro.

Here are the two in comparison.  On top, the daily increase in solar output vs 2013.  On bottom, the daily shortfall in hydro output.  Both are on the same scale (0-40 GWh per day).


Tuesday, April 22, 2014

Growing Impact of Solar Power in the Southwest

Solar continues its rapid expansion in California, both distributed and utility scale.  The real impact of the incremental additions will be felt this summer, when daily generation peaks in the afternoon instead of after dark.  In April, the peak is normally around 8 pm, so solar power is not shaving the peak.  

Considering the average April daily load profile, here is the impact of utility scale solar additions in the last year.   Again, this is how much more solar generation was added in the last year. 


And here is the total current solar generation, as a component of average daily April load:


California should see a massive impact from solar energy expansion this summer.  With over 100,000 rooftops now generating solar power on the other side of the meter (not reflected in the charts above), the total load should also see a reduction this summer on-peak.  Estimates indicate that something like 800 MW of distributed solar are already operating in California, and growing.  

This should accelerate the collision that appears inevitable between all the stakeholders of electric power, including the independent power providers.  It is conceivable that total solar generation capacity could exceed 7 GW in California by next summer.  

A compounding problem is the lack of power demand.  Total electricity sales is in a noticeable decline in CA this year.  The grid will be stressed, as will the balance sheets.


Monday, April 21, 2014

Western US Hydroelectric Generation Update: Lower Estimates

The hydro picture out west is mixed.

Stream flow forecasts continue to hold above normal in the Northwest, up slightly from last week to 105.5% of normal:

But the Sierra Nevada outlook is dry, with the statewide snow pack estimate down to 18% of normal for this date.


But this has not translated into significant declines in hydro generation in CAISO yet, with daily generation only off by about 15 GWh per day lately, versus last year.  Lower snow pack should show itself by June, as flows fall off earlier than normal.


Meanwhile the BPA generation in the Northwest is running above last year again, lately averaging about 11 GW, or about 1 GW above this time last year.


Finally, the snow pack in the Colorado River Basin has fallen, with melt beginning sooner than normal.  This is raising river levels and filling the larger reservoirs (Lake Powell and Lake Mead) more quickly than normal.


Monday, April 14, 2014

Cooling Demand

US cooling requirements for the current week (through Saturday) are forecast by NOAA to be near normal at 8 CDD.  CDD's were much higher last year at 13.

From a natural gas demand perspective, the states that typically burn the most gas to support air conditioning demand in summer showed a mixed picture for the current week.  Texas is expecting a below-normal load, while Florida will be much above normal.  California shows no significant cooling load yet, and total electricity demand remains low in the west.


California daily electric generation demand has only been higher than 2013 on 12 days in 2014, including three last week during a brief warming spell.  Overall the electricity demand picture in the west is poor, due in part to the massive distributed solar (residential and commercial rooftop) boom.


It has been a different story in Texas this year with both weather-related demand and baseline demand up vs 2013.


Saturday, April 12, 2014

Western U.S. Hydro Power Outlook

Snowpacks remain strong in the Northwest and in the Colorado River Basin, and weak in the Sierra Nevadas.  Current stream flow has declined in the Northwest, reducing power exports to California.  Demand remains suppressed on the west coast, with mild weather in the near term forecast as well.

Bonneville Power hydro output, by far the largest anywhere, has been falling recently, from a high level around 12,500 MW in late March to about 10,500 MW recently:

The stream flow forecast for the Columbia River is still above normal, at 105%:


Meanwhile California hydro power output is still lagging last year by a relatively small amount, less than 20 GWh daily:


Snowpack conditions in the Sierras are worsening slightly, at 29% of normal:


And snowpack in the Colorado River Basin has now dropped below normal, likely due to some warmth and melt.  Normally the pack would continue to build for a few weeks more:


Friday, April 4, 2014

An End to Surplus Hydro Power in the Pacific Northwest

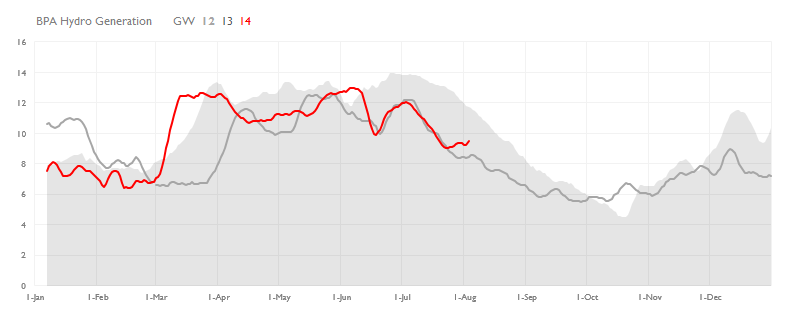
The Pacific Northwest has been enjoying high hydroelectric power output relative to last year, for about a month now.  The difference is large enough to register on the national level, at more than 5 GW above 2013.  That displaces a lot of natural gas.  Probably close to 1 BCFD for most of March.  But that is coming to an end now, simply because hydro generation rose sharply at this time in 2013.  

Thusfar, Bonneville Power Administration has been reducing thermal output and sending more power south the California.  The flows may not change much, but the abnormally low natural gas demand should move back toward levels comparable with 2013 now.

The northwest hydro story.....

As reflected in lower northwest thermal generation last month.....

and higher electricity exports.....

Sunday, March 30, 2014

Seeing the Impact of Distributed Solar Power in the West

As more rooftop solar (residential and commercial) is deployed in California (the leading state for distributed solar capacity, by far), the impacts are being seen on the grid.

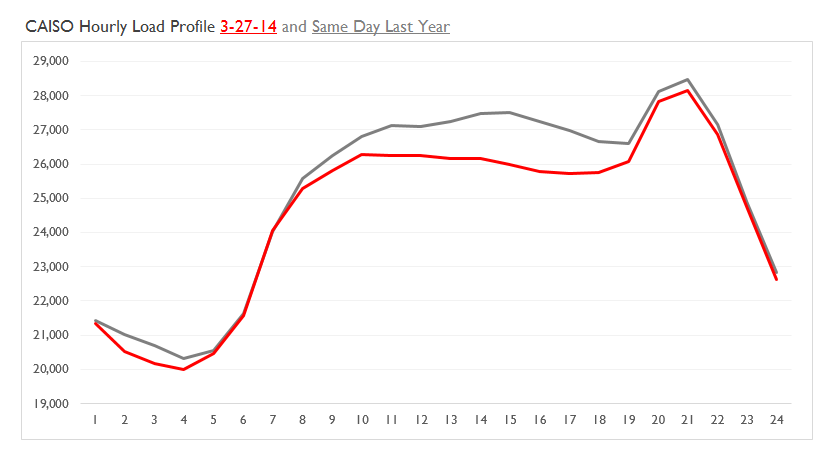
The solar generation hours (between 7am and 7pm in March) are showing a marked decline in load profile.  Here is a typical example, from Thursday March 27, 2014 compared to Thursday, March 28, 2013.  The difference in peak load is only about 300 MW, but the daytime difference peaks about 3pm at 1,500 MW.

It does not require an advanced degree to see where this is going, nor to see what the impact on peak load would be if battery storage rolls out in sufficient quantity to store some solar power for about 5 to 6 hours (economically).  


Sunday, March 23, 2014

Solar Power Generation Growth in California

As days lengthen toward summer, solar output is rising and more projects are being commissioned in the leading state for solar power, California.  At the moment, the year on year growth in solar output is compensating for the lost hydro due to the drought.  It now seems likely that peak summer days will see output near 50 GWh when all plants are operational and cloudless skies prevail.  The concentrating solar thermal project that has received so much media attention, Ivanpah, is not operating at full power consistently yet.

Total demand in the CAISO region in March has averaged about 570 GWh per day through the 21st, and solar output has averaged 28 GWh, almost exactly 2% of the total demand.


Thursday, March 6, 2014

Electricity Load Profile....Is the Peak Being Shaved?

NRG Energy President David Crane frequently describes an apocalyptic future for conventional power generators where the daily load profile loses its distinct peak during high demand periods, and he claims that power producers won't make money in that world.  That is primarily because distributed generation and energy storage will increasingly shave that peak.  He says it will happen faster than anyone expects, due to the rapid pace of technology and affordability of distributed solar power and battery storage.

So NRG is planning for that kind of future (so they say).  On paper, we should be seeing this already in vanguard regions like California.  There is little battery storage yet but solar generation is expanding so quickly that summer afternoon peaks should decline relative to average daily generation.  

Right now it should not be visible because solar power generation falls to zero before 6 pm (sunset) and peak load is typically between 7 and 8 pm, as it was today:


But as spring waxes and California heats up, daytime generation demand rises and the sun sets later.  This causes the daily peak hour generation vs daily average generation ratio to decline.  Here is the 7 day average of that ratio last year and this year so far in Q1.  (It is worth noting that total generation is distinctly lower this year than last, on nearly ever day in 2014).


Meanwhile the EIA, in what is a true but perhaps backward looking analysis, draws attention to the heretofore rising ratio:


I think this summer will begin to test this sea change in California.  Battery installations will really be the key, but when the sun begins to shine through the daily peak, it will show in the data.  We will see both the institutional solar output on the grid, and should see the shadow of the missing demand, replaced by distributed solar (ie residential and commercial rooftop).  We should not have to wait long.

Wednesday, March 5, 2014

Solar Power: Small But Growing Problem for the Grid and Natural Gas

Solar has been such a small contributor to power generation in the U.S. that the growth rate has not been relevant heretofore.  Let's start with the statistics for 2013, published today by Green Tech Media:


This study estimates the installed base of solar on 12-31-2013 at about 13 GW.  This means that 37% of capacity was installed in 2013.  The study estimated 2014 installs at 6 GW, putting capacity at about 19 GW by end of year.  

This is not so very small anymore.  The solar industry is in booming but anxious chaos right now, due to the regulatory, competitive, and technological environment.  Still heavily dependent on subsidies and protection, the solar market varies wildly from state to state, because regs, insolation, and power prices vary so much.

The news is out that renewables have gutted the european power market and incumbent utilities.  The landscape is certainly very different over there, but people are wondering just how different.  

I like to look closely at California because it represents the prime market for solar.  It has all three variables aligned:  High power prices, incredible sunlight, and favorable regs and protections for solar (both utility scale and distributed generation).  It also has one other important thing:  declining demand for electricity.  That spells trouble for power producers and means that the market is probably destined for reform soon.  

On the technology frontier, there are three things that matter most:

  • Solar PV prices coming down down down
  • Solar PV efficiency rising (overlaps with #1 above)
  • Battery storage pairing with solar to achieve escape velocity (ie grid defection for consumers)


This revolution may happen faster than the market expects.  The private sector achieved a surprising rate of residential solar penetration in CA as competition, innovation, and financing drove installations 'through the roof' as it were, for rooftop solar.  So much so that the utilities have resorted to extreme stalling tactics to slow grid connection for net metering customers (its about 8 months or so in California now, and at a dead stop in Hawaii).  

The concern here is that continued improvement in a few of the price/efficiency variables could push solar beyond the need for subsidies, which could strand billions of dollars in legacy generation assets, force grid maintenance costs onto fewer customers, and basically break a stable, bond-financed industry.

But is this apocalyptic nonsense that is really promotional hype by the renewables industry?  At one level yes, because the old saw that 'what can't happen, won't happen' does apply.  The grid is necessary and so probably everyone will pay something, even those who don't use it.  And subsidies are still so important that removing them will 'level the playing field' for awhile.  

Of upstream interest though, is the impact if any on fossil fuel feedstock producers.  Both coal and natural gas.  So much of the cost of electricity is capital related (depreciation and cap-ex), not variable, that unless these costs go away through bankruptcy, they will continue to be borne by consumers somehow.  This would suggest that the retail price of energy isn't going to collapse (Though it did in Europe.  Forward power price is shockingly low through 2015).  But if perchance the U.S. has already achieved peak generation (unlikely) then usage declines could have a brutal impact on prices, so it is worth keeping one eye on that.

But how can we waste ink on a power source that averaged 25 GWhD in 2013, when total generation averaged 11,150 GWhD?  That's less than 1/4 of 1%!


Part of the issue is mathematical.  Average generation is a lagging indicator during such a high growth phase, and most of the 2013 capacity additions were installed in Q4.  On average, solar output is around 25%-30% of capacity (due to darkness).  If we assumed 30%, then 2014 would have an exit rate, at 19 GW capacity, of 136 GWhD, or 5x the average output in 2013 and over 1% of the annual national total.  That gets more interesting, especially in a market that isn't showing much aggregate demand growth right now.

It is hard to say what the growth rate beyond 2014 will be, since the regulatory environment is hard to predict, as is the rate of technological progress.  But several of the technical issues could reach a tipping point if they push the economics beyond the bounds of subsidies, and combine with other technologies (battery storage).  

This is less a thesis about renewables and the hope for a new world, than it is about just how much 1% market share really matters.  It matters a lot.  And solar has two great qualities:  It shines during a high load period, and it shines during a high seasonal demand period.  It is worth way more than wind.  And it has the potential to outperform wind in generation cost as well.  Solar may never actually get there, but wind cannot get much more efficient (I think).  Turbines can get cheaper, yes.  but not like solar can.  And solar can penetrate much faster because it can be distributed, unlike wind.

I look for big conflict between competing interests, and some big technology announcements, in 2014.  A primary energy topic to watch, and something that could have a big effect on the outlook for natural gas.


Saturday, February 15, 2014

The Measure of Solar Power Progress in California

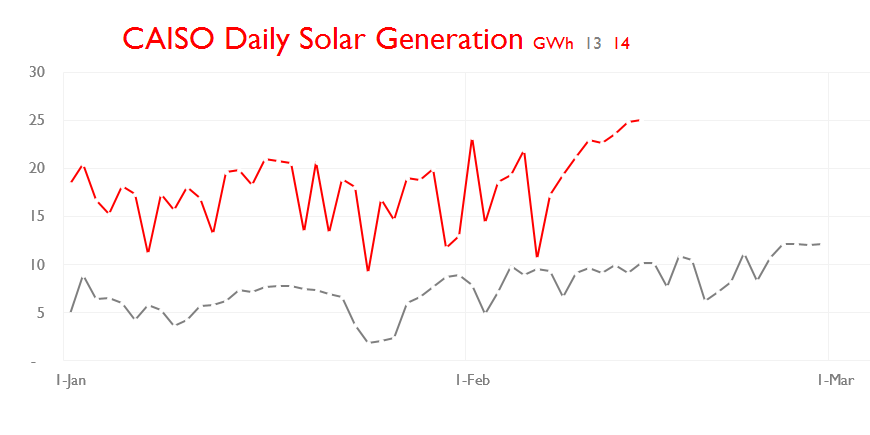
Last week saw the commissioning of the large solar thermal plant at Ivanpah.  It is about 400 MW capacity and should be visible in the daily solar output of California.  Many other Solar PV projects have launched or expanded in the past year, making California the guinea pig in the grand renewables experiment.  

A snapshot the daily solar output YOY in the California ISO so far this year:


This represents about 4% of the daily demand in the CAISO region right now.  Normally that demand grows substantially with the onset of summer cooling requirements, but solar will increase even more, as the sun shines higher for longer and new capacity comes on line.

It is easy to look that the aggregate totals and say that solar still doesn't make a meaningful difference, but that is not a complete analysis.  The load profile is very good and very predictable for solar in the summer out west.  Yes clouds reduce output, but those are largely foreseeable and also reduce cooling demand in summer.  The fact that solar has a peak shaving effect also complicates things for the grid and for complimentary fuels.

Look at yesterday's generation requirements (Fri Feb 14), and see the solar contribution:


Outside of summer, there is typically one obvious peak, around 7 pm in the evening.  But a typical July day peaks in the late afternoon.  Let's look back at Friday July 12 last year:


Here the peak is between 4 and 5 pm, and the longer day extends solar's contribution until almost 8 pm.  This will reduce the need for some of the most expensive power in the US of A, peak summer California demand.  

We also can't ignore two other trends where California may be the vanguard.  The first is distributed solar, made up mainly of 'rooftop solar', which is penetrating the market out west rapidly, due to several factors already well known (sunny, subsidized, and 3rd party financed to name the biggest).  This should be shaving grid demand along the same daily generation profile as the institutional solar measured above.  

The second trend seems to be declining demand.  California generation requirements so far this year have been consistently below 2013.  Here's a broad brush look:  Aggregate daily demand comparison.


Not only has it been below last year on all but 3 days this year so far, but the daily peak has followed a similar trend.  That's important because the peak occurs after sunset, when solar (utility or distributed) is not a factor because output is at zero.