Pages

Showing posts with label Wind power. Show all posts

Tuesday, June 13, 2017

Fossil Fueled Electricity Pie is Shrinking

Renewables are driving gas out of the dispatch curve in most major power systems across the US.  Out west, solar is the driver.  Everywhere else, it is primarily wind.  Renewables are benefiting from learning curves, price advantages, legislation, subsidies, growing awareness/favorability, and supporting technologies.  I think the hope for fossil fuels was that the pie itself (load) would also be growing.  The hope for natural gas was also based on some well known advantages over coal.  

However. 

The reality is a story of victimization by success combined with economic stagnation.

Wind is the pupil at the head of the class.  It is doing so well, especially in ERCOT and Southern Power Pool.  It has seen rapid installation and a steadily rising capacity factor.  

Here is one small illustration.  With large YOY increases in wind output, Southern Power Pool is generating more non-fossil power (mostly wind).  With wind averaging almost 12GW of output for the last four days (a big new record), the running 30 day average output for non-fossil fuels has held well above the prior year average all through 2017: 


and with gas taking less market share from coal, due primarily to price differential:


It will be hard for natural gas demand to rise to the levels seen in prior years under these circumstances, especially if total electric demand stagnates, which seems to be happening almost everywhere.

It will take special weather or something more dramatic (curtailment of the nuclear fleet?) to light a blue flame under natural gas at this point.  Supply is promising to overwhelm in Q3-4 as well (maybe that won't materialize?), so the $2's may be the new home for Henry Hub.  LNG is ramping up but it's slow and a known quantity.  Supply disappointment is most likely to come in the form of temporary delays, so a price catalyst may be lacking for a while.


Tuesday, May 9, 2017

Another Giant Leap Forward for ERCOT Wind Power Generation

ERCOT released its Demand and Energy Report for April 2017 this week, and wind power posted another record, up 47% over last April, and within 25% of both Natural Gas and Coal in total generation.  It averaged about 9 GW for the month:


Meanwhile, natural gas lost market share to coal in ERCOT:


Tuesday, April 11, 2017

ERCOT Reports March Fuel Mix

ERCOT's Demand and Energy Report for March 2017 was released yesterday.  It shows natural gas gained against coal:


But it also shows that the thermal power pie continues to shrink:


One big reason, besides low/no demand growth, is wind.  A big new generation record was set in March:


Sunday, March 19, 2017

MISO Coal to Gas Switching Snapshot: March 2016 vs 2017

Load-adjusted, gas is averaging about 5 points of thermal marketshare below last year in March.

The slope is also different, with market-share varying more directly with overall thermal load size.  With lower demand anticipated as weather moderates in the back half of March, the market share loss should be more pronounced, since thermal demand in the 8-10 BCFE range is showing a gas share around 37%, vs last year at 43%.


Compounding this loss for natural gas is the higher wind output experienced in MISO.  Average daily wind output is 185 GWH this month, vs 135 last March.  That's a MASSIVE difference, displacing something on the order of 400 MMCF per day.  (The increased wind output isn't just in MISO either, it is big in SPP and ERCOT)


Thursday, March 9, 2017

ERCOT Reports February Generation Fuel Mix

ERCOT released their Demand and Energy Report for February 2017 today, and the results are both expected and alarming.  Total generation was off about 2.6% from last Feb, likely due to weather.

My focus was on two things:

Wind power generation....capacity is up from 2016, and the capacity factor seems to be up even more (next gen windmills, better siting?).  In any case, wind generation was up 19.4% over last Feb, from about 6.7 GW average, to 8 GW.  The difference is even larger in March to date.

Market share of thermal output.....it was 60.9% this Feb, vs 64.4% last Feb...down on lower total load and losses to wind.

Natural gas market share of thermal output.....it was 50.7% this Feb vs 67.1% last Feb.  Gas was much more expensive this year.  Falling prices in March should improve this a bit, but last March, gas took a whopping 79.3% of the thermal power market.


Thursday, March 2, 2017

Henry Hub Spot Price Comparisons

As shoulder season approaches and gas prepares to battle with coal for power generation market share, here is the current scenario:

Gas has been taking back significant market share from coal since prices began dropping two weeks ago.  But contango still reigns, and the summer is priced a little too high for gas to seize the massive market share it took from coal last spring/summer.  

Gas production remains subdued relative to last year, and to expectations.  That will be very supportive if the trend continues, but 1Q reports by E&P's suggest it will not, at least in Q3+.  

If production begins to bound forward, prices will likely come under downward pressure because:


  • Hydro surpluses will destroy 1BCFD or more of gas demand all summer
  • Renewable energy (solar and wind) will grow by about that same amount again, displacing around 1 BCFD of gas demand.
  • Weather was warmer than normal last year (see previous post), which will drop NG demand if we experience a normal summer, perhaps by more than 1 BCFD.  
Obviously this is all against a backdrop of positive variables as well, such as LNG exports and pipeline exports to Mexico, which are all up significantly.  And of course some coal plant retirements.  The economy could also generate some incremental demand due to GDP growth stemming from either a recovery or stimulus.  Lastly, we should see steady small upticks in industrial demand due to long lead time projects coming into service.

Also note how year-on-year pricing improves beginning in June.


Sunday, January 29, 2017

Southern Power Pool Wind Generation Jumps 50% Between Jan 2016 and Jan 2017

Wind capacity additions mostly came in the SPP region last year, and it shows.  Monthly generation has been consistently beating prior year, and this January is an extreme example.

Average output for the month to date has been around 6.2 GW, while it was closer to 4.1 GW last year. Here are the daily averages, with January '16 in grey, and January '17 (to date) in red.  If all this new power generation offset natural gas fired turbines, it would equate to roughly 0.5 BCFD.  That's a lot.  


Sunday, December 18, 2016

ERCOT Wind Generation Just Misses New Record

ERCOT narrowly missed setting a new record for wind generation yesterday, hitting an hourly peak of 14,912 MW.  On Nov 27th, the all time record was set at 14,951 MW.

Nonetheless, a tremendous amount of wind power was generated over the recent two day interval, as the area chart indicates.


Friday, December 16, 2016

New Wind Power Record on Deck in Texas (ERCOT)

Tonight about midnight central time, Texas is projecting 15 GW of wind output:


This will break the existing record of about 14 GW, and at a time when system load is projected at just 32 GW:

Tuesday, July 29, 2014

May 2014 Electric Power Monthly

US power generation in May was comparable to last year, at 10.42 vs 10.39 GWhD.  Weather was comparable, as '14 had +9CDD and -10HDD vs '13.
Electric Power Monthly


By feedstock, there were slight absolute losses for coal, and a 5% gain for natural gas.  Nuclear was off slightly, as were renewables.


Hydropower fell to a 4 year low, down 8% over '13, and solar hit another high in what should be another year of uninterrupted monthly records.


Thursday, July 3, 2014

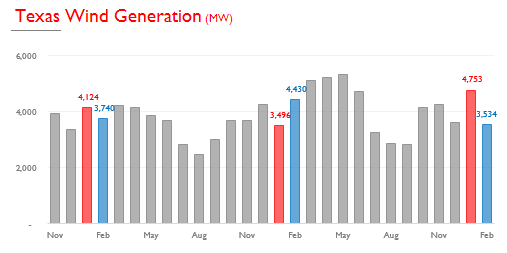
Wind Generation in Texas (ERCOT Region)

The month of June ended with very steady and strong wind generation in Texas, as output held near 9,000 MW for four days straight.  That helped June average 5.45 GW of wind output, vs 4.70 GW last year and 3.66 GW in 2012.

With significant additional generating resources installed at the beginning of the year, output should reflect that capacity growth through the summer, though July-Sep is historically low.


Tuesday, May 27, 2014

Texas Wind Generation Lags in May Despite Capacity Increases

Texas wind generation has lagged 2013 since January 2014.  This month, output will likely do so again.  With 4.5 days remaining, the forecast for today and tomorrow indicates output will not exceed 4 GW.  


Saturday, May 24, 2014

FERC Electricity Infrastructure Report

FERC reports on the US electricity infrastructure monthly here, identifying new power capacity by type, and total operational capacity by type.  It does not delineate decommissioned capacity.  

It is particularly helpful in tracking renewable capacity.  FERC reports for April 2014 the following capacity.  Notice the steady growth in Solar, the recent increase in wind, and the declines in both coal and natural gas.  Coal capacity should be dropping precipitously in the next 24 months.


Friday, May 23, 2014

EIA Electric Power Monthly: Coal Gains on Gas in March

EIA released its electricity report for March 2014, and it shows a slight year-on-year increase in total generation, and a notable loss in natural gas market share, in favor of coal.
Electric Power Monthly


Output comports roughly with the weather, which was notably cold in March.  Last march was also colder than normal, but 2012 was very warm:


Natural gas prices were spiking regionally in March to unprecedented levels, which likely accounts for the loss in generation market share.  Coal is up about 5% over last March, while gas consumption fell 8.6%.


Intermittent renewables continued to nip at the heels of fossil fuels, with wind and solar both setting new March records.  Hydro was also up over last year but below historical norms.


Friday, May 9, 2014

ERCOT Wind Power

Here are the hourly profiles of wind generation in the ERCOT region of Texas this year.  It gives a good sense of the variability of wind output in this region.

Although more wind capacity has been added in 2014, output has been a bit below the historical trend for Jan-May this year:


Thursday, April 10, 2014

Wind Capacity Growth Projection in Texas

Here's a notable graph from the Texas ERCOT Monthly System Planning Report that shows anticipating wind capacity additions.  It is hard to believe that power demand in the lone star state will grow much faster than these additions, since a 30% capacity factor is a reasonable rule of thumb.  This shows that capacity additions have been very low for five years, and are expected to ramp up drastically in 2014 and again in 2015.  At a 30% capacity factor, this would yield 1,100 additional MW of output in '14, and another 1,025 MW in '15.  That would absorb about 2.5% in total load growth per year in ERCOT, and thus leave little for NG and other electricity sources.  (The intermittency of wind is a separate and significant issue influencing the mix of other generating resources.)


Monday, April 7, 2014

Texas Wind Power Expansions

Improvements to the ERCOT power grid brought more Texas wind capacity online in January 2014.  But after an initial surge in wind power output in January, weather and other factors have reduced output relative to 2013 in Feb, Mar, and so far in Apr.  In fact output has closely tracked 2012.

Here are the hourly wind power profiles for each month, and the average output by month since 2012.  It highlights both the hourly variability and the wide range in aggregate output over time from wind.  (Output can range from 1,000 MW to 10,000 MW over a 24 hour period!)


Friday, February 28, 2014

Wind Power Expansion and Output in Texas

Wind capacity was expected to increase in Texas in early 2014 due to transmission line debottlenecking.  Texas is the largest producer of wind power in the US and it continues to grow.  But wind output is unpredictable, especially in winter away from coastal areas.  

Here are the 1 hour generation profiles of wind output in Texas so far this year.  Note that the wind didn't blow for several (cold) days in mid-February.


Wind output in Texas did set a new record for January, but it is down substantially in February.  The month ends tonight, and generation is averaging about 900MW lower than last year.  Severe cold, which we have seen this year, tends to be inversely correlated with wind, which probably explains the decline.