Today's 3 gas rig decline to 183 reflects a 2 rig drop in the Haynesville and a loss of one in the Marcellus. Counts remain high but clearly on a decline.
In the Marcellus however, at 61 rigs the fleet remains larger than at any time in 2018 or before.
Finally in the Permian, the gas rig count remains at zero of course, while oil rigs are at 459. This tells the story of associated gas....
Friday, May 3, 2019
Thursday, May 2, 2019
EIA Natural Gas Inventory Rises 123 BCF
Another large injection (+123 BCF) was reported this week, which reduced the deficit to the 5 year average to -316 BCF. Large early season injections are expected to transition mid-summer to a tighter balance, as exports ramp up. Even so, these spring injections have been larger than expected, and prices reflect that, with the summer strip falling into the $2.60's.
The last four weeks have a total 5-year average injection of 143 BCF, and this year it has totaled 332!
The daily weather anomaly, in Heating Degree Days, is certainly below average, with all but 7 days in the period warmer than normal.
Yet, the period totaled 314 HDD's this year, against a 20 year normal of about 364. That would normally translate into something like 100 BCF in reduced gas demand. Thus, unusual weather explains about half of the excess injections.
Wednesday, May 1, 2019
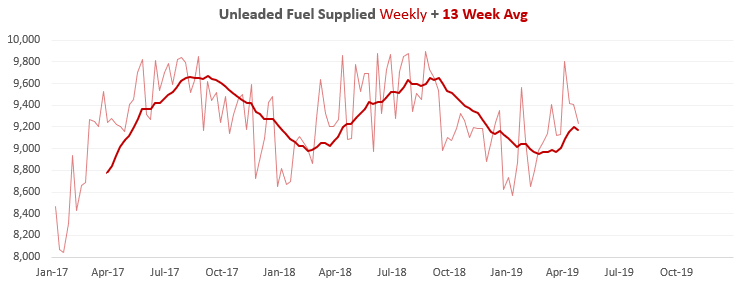
Unleaded Fuel Consumption: Down on the Week and on the Year
Today's EIA release was a bit disappointing from the demand side. Unleaded fuel supplied is now down 100KBOPD year to date:
Tuesday, April 30, 2019
Pemex: MARCH Oil and Gas Production Show Steady Gas Output, Further Oil Declines
Pemex daily oil production fell by 7K in March to 1.069 MMBOPD, on trend to cross 1.5 MMBOPD by year end. Gas was down minimally, to 4.857 BCFD, continuing a 6 quarter streak of almost level output.
Light and Extra-light oil output is down the most over a 3 year period, in percentage terms. From a regional perspective, marine, and southern onshore, have been declining the most.
Gas output details reveal onshore decline trends, with marine output recovering erratically over the last year:
Monday, April 29, 2019
Coal Power Decline in Southern Power Pool
Coal-fired power in SPP (Southern Power Pool) declined sharply in March-April. Here is the Year-on-Year comparison for both coal and gas fired power. While gas is taking a much larger market share of fossil fuel generation now, the net effect has not yet resulted in more gas use because total load is down, wind generation is up, and nuclear is also up.
Subscribe to:
Posts (Atom)