Pages

Monday, February 17, 2014

Electric Power Feedstock: Coal vs Natural Gas

Coal and Natural Gas are the primary feedstocks for electric power generation in the U.S.  But the other power sources are always dispatched first (generally speaking).  So coal and gas can only compete for the remainder of power generation demand after renewables (including hydro) and nuclear are fully utilized.
And in the absence of power generation demand growth, a condition that has prevailed in recent years, this is a simple cage fight between the two resources.  

Here are their relative shares of that 'addressable market' for the last three years, through October 2013, per the EIA.  They were briefly at parity in April 2012, and gas has been ceding back territory to coal as gas prices have risen.  That isn't a trend that is expected to continue, but this does illustrate that the basic laws of economics and elasticity will always be an important factor in projecting future gas demand.

There are some other factors that explain part of the monthly variations below, but generally it reminds us that coal is always waiting as an affordable alternative to gas fired power generation.


Nuclear Power Report: Week Ended Feb 14 Output Above 2013

A lighter refueling schedule and fewer unscheduled outages lifted nuclear power output above last year in the week ended Feb 14.

The following reactors were reported off-line on Feb 14:
Palisades
La Salle 1
Grand Gulf 1
Hatch 1
Davis-Besse
Diablo Canyon 1
Fermi 2

PDF Report

Heating Degree Days: 243 Last Week vs 203 Norm. Forecast Week Warm: 164 vs 192 Norm

The NOAA Gas-Weighted Temperature data for last week (through Sat Feb 15) came in colder than forecast, and much colder than normal.  It raised the YTD cold anomaly to +144 HDD's.  But the current week forecast is significantly warmer than normal (-28 HDD).  

Sunday, February 16, 2014

Western Canadian Natural Gas Inventories Fall Sharply for Another Week

This familiar graph of winter natural gas withdrawals in Alberta shows another week of exceptionally high storage withdrawals.  With about 250 BCF withdrawn in the current winter, it exceeds last year by 145 BCF.  Outflows from storage were down slightly in the last two days, but still near 3 BCFD.


The daily outflows:


Saturday, February 15, 2014

The Measure of Solar Power Progress in California

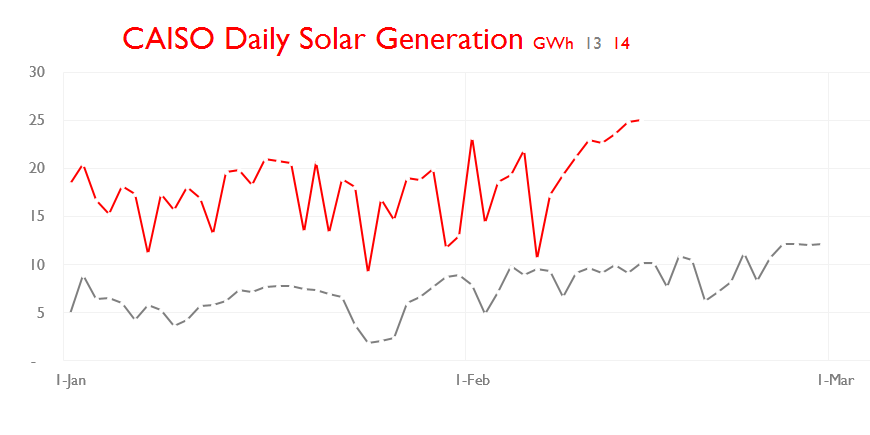
Last week saw the commissioning of the large solar thermal plant at Ivanpah.  It is about 400 MW capacity and should be visible in the daily solar output of California.  Many other Solar PV projects have launched or expanded in the past year, making California the guinea pig in the grand renewables experiment.  

A snapshot the daily solar output YOY in the California ISO so far this year:


This represents about 4% of the daily demand in the CAISO region right now.  Normally that demand grows substantially with the onset of summer cooling requirements, but solar will increase even more, as the sun shines higher for longer and new capacity comes on line.

It is easy to look that the aggregate totals and say that solar still doesn't make a meaningful difference, but that is not a complete analysis.  The load profile is very good and very predictable for solar in the summer out west.  Yes clouds reduce output, but those are largely foreseeable and also reduce cooling demand in summer.  The fact that solar has a peak shaving effect also complicates things for the grid and for complimentary fuels.

Look at yesterday's generation requirements (Fri Feb 14), and see the solar contribution:


Outside of summer, there is typically one obvious peak, around 7 pm in the evening.  But a typical July day peaks in the late afternoon.  Let's look back at Friday July 12 last year:


Here the peak is between 4 and 5 pm, and the longer day extends solar's contribution until almost 8 pm.  This will reduce the need for some of the most expensive power in the US of A, peak summer California demand.  

We also can't ignore two other trends where California may be the vanguard.  The first is distributed solar, made up mainly of 'rooftop solar', which is penetrating the market out west rapidly, due to several factors already well known (sunny, subsidized, and 3rd party financed to name the biggest).  This should be shaving grid demand along the same daily generation profile as the institutional solar measured above.  

The second trend seems to be declining demand.  California generation requirements so far this year have been consistently below 2013.  Here's a broad brush look:  Aggregate daily demand comparison.


Not only has it been below last year on all but 3 days this year so far, but the daily peak has followed a similar trend.  That's important because the peak occurs after sunset, when solar (utility or distributed) is not a factor because output is at zero.