Pages

Tuesday, January 31, 2017

Nuclear Power Output Steady at +1 BCFE vs 2016

This week marks the first period since early December that US nuclear power generators maintained a capacity factor substantially above 2016.  Yesterday's factor, 95.6%, was 5% above last year, and the natural gas displacement of this high output is exceeding last year by almost 1 BCFD right now.  

The difference should diminish over the next 3 days, as last year's capacity factor rose sharply during the same period:


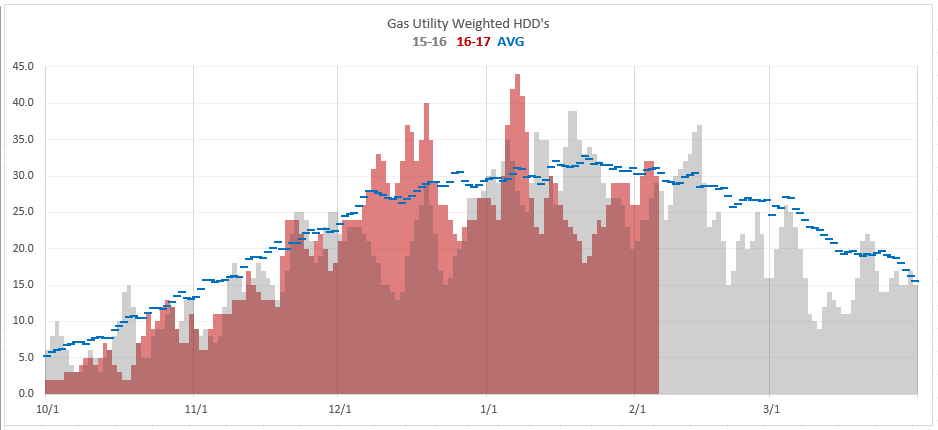
2016-17 Winter Isn't Shaping Up to be Cold. Looks About Like 2015-16

A cold mid-December and then a short intense blast in early January have been the only above average cold periods so far this season, and we are only about 50 HDD's ahead of 2015-16 right now, with the prospect of losing that lead over the next 15 days.

Cold forecasts just haven't come to fruition, and time is running out:


Monday, January 30, 2017

Pemex Reports December Oil and Gas Production Falls to New Lows

Pemex seems almost to have exited the drilling and exploration business altogether, as December output fell sharply to continue the multiyear trend toward output collapse.

Crude oil output fell 37M BOPD to 2.035 MMBOPD, or a 240 thousand barrel per day decline over last December.

Natural gas output fell 135 MMCF per day, or 2.4% to 5.38 BCFD, or a 0.83 BCFD decline over last December.

The charts and graphs tell the story better:


Northwest Hydropower Loses Output, No Longer Exceeding 2016

The Bonneville Power Administration reports declining hydro output over the last 11 days, falling to more than 2 GW below last year.  This is resulting in higher thermal generation and lower exports to California.  This difference is about equal to the excess hydro generation we have been seeing recently in California, so the net effect is about zero right now vs last year's hydro output.  This represents a significant change from early January, when both CAISO and BPA were reporting strong hydro power:

BPA Hydro output:

BPA thermal generation:


Sunday, January 29, 2017

Southern Power Pool Wind Generation Jumps 50% Between Jan 2016 and Jan 2017

Wind capacity additions mostly came in the SPP region last year, and it shows.  Monthly generation has been consistently beating prior year, and this January is an extreme example.

Average output for the month to date has been around 6.2 GW, while it was closer to 4.1 GW last year. Here are the daily averages, with January '16 in grey, and January '17 (to date) in red.  If all this new power generation offset natural gas fired turbines, it would equate to roughly 0.5 BCFD.  That's a lot.