Pages

Friday, February 28, 2014

Rig Counts: Oil +5 Gas -7

The transition from gas to oil drilling continued in the US this week, with oil rig counts up +5, including +5 horizontal rigs.  Gas rigs fell another 7 rigs (6 horizontal, 1 vertical) to 335, and are now down 85 from last year at this time.

Canadian drilling activity remained strong before upcoming seasonal decline in activity, with oil rigs +2 and gas -6 (an 11 rig decline in Alberta).

The Permian and Eagle Ford remain the most active regions by a large margin.  Most of the mature gas basins (Barnett, Fayetteville) showed flat activity on the week, while the long term downward trend in drilling in the Granite Wash continued, with oil rigs down 2 to a half year low, and gas rigs down 1 to a paltry 5 rigs running.

Notable Changes:

  • Permian basin momentum continues, with rigs up 6 to 493
  • Marcellus drilling declined by 4 rigs to just 78, but three of the lost rigs were vertical.  That's down 18 in a year.
  • Granite Wash activity declined by 3 rigs to 51, down 18 in a year
  • Utica drilling was flat at a strong 41 rigs.  
  • Haynesville gained 1 rig to 42.


Activity in the new and/or growing plays:


Wind Power Expansion and Output in Texas

Wind capacity was expected to increase in Texas in early 2014 due to transmission line debottlenecking.  Texas is the largest producer of wind power in the US and it continues to grow.  But wind output is unpredictable, especially in winter away from coastal areas.  

Here are the 1 hour generation profiles of wind output in Texas so far this year.  Note that the wind didn't blow for several (cold) days in mid-February.


Wind output in Texas did set a new record for January, but it is down substantially in February.  The month ends tonight, and generation is averaging about 900MW lower than last year.  Severe cold, which we have seen this year, tends to be inversely correlated with wind, which probably explains the decline.


Thursday, February 27, 2014

Nuclear Power Output Declines, But Exceeds 2013

As the plant refueling season continues, more reactors are offline but power output remains above 2013.  More units are scheduled for refueling this season than were offline in 2013, so further declines are likely and should push output below last year.


Western Canada Natural Gas Storage Declines

As winter and high prices linger in North America, Canadian storage operators continue to sell aggressively into the southbound pipelines, as last week's daily withdrawals averaged more than 2.5 BCFD.  The current winter has now seen 162 BCF more gas withdrawn from storage vs last winter.

Daily gas production in Alberta has not exhibited a strong trend yet in 2014, with several complicating variables but a continuing high gas rig count.


EIA Natural Gas Inventory: 95 BCF Withdrawal

Natural gas prices declined slightly on the news of a -95 BCF change in US Natural Gas Inventories this morning.  Gas in salt dome storage increased, signaling an increased ability to cope with upcoming cold patterns across the eastern and central US.  The low withdrawal number reflects mild weather, a rare phenomenon this winter and something that will not persist, as withdrawals are expected to increase through the first week of March, pushing inventories near 1,000 BCF.

PDF Report


But a colder outlook today pushes carryout inventory projections down slightly to 946 BCF


Wednesday, February 26, 2014

EIA Weekly Petroleum Status Report

Today's EIA Petroleum Status Report was notable for continued declines in oil inventories at Cushing, OK (down 1.078 MMBBL) as well as improvement in the trade balance with crude imports declining and product exports up.   Mild weather also took the pressure off of propane, reducing demand and holding inventories nearly flat (down just 39K Barrels).  Crude production also fell, with declines in both Alaska and the Lower 58.


Tuesday, February 25, 2014

EOG Reports Eagle Ford Drilling Results: More Liquids, Less Gas

EOG reported Q4 2013 results yesterday, and provided details of their Eagle Ford drilling program.  Here is a summary of the well results they reported.  These are initial production rates only, so the oil:gas ratios may vary significantly over time.  But it is worth noting that the dry gas component of production is small and getting smaller.  These are also fantastic well results, as Wall Street recognized.  They also support an important new trend, that of increasing well productivity in the western portion of the Eagle Ford.

Overall, dry gas comprised only 5-10% of production, with Gonzales County at the high end and La Salle at the low end of the range.  These ratios are much more oily than the current production in these counties, and likely foretell a decline in the casinghead gas % of future oil completions, since EOG is operating 26 rigs, more than 10% of all EF rigs.


Western Canada Drains Natural Gas Storage Further Amid Higher Exports and Consumption

More cold weather kept AECO natural gas prices sky high for another week as Alberta drew another 17 BCF from already low inventories, increasing winter withdrawals to 271 BCF, about 157 BCF greater than last year.

Daily production has recovered somewhat from 2014 lows, recently varying around 10 BCF per day in field receipts, or 200-300 MMCF above last year.

PDF Report


Monday, February 24, 2014

Gasoline Consumption: Driving Trends and Efficiency Trends

The great recession in the US coincided with changes in consumer behavior that were unexpected, and to some extent still not explained.  For decades, GDP growth and population growth were closely correlated with the lightbulb and the car....Americans drove more miles nearly every year, and used more electricity.
Now those correlations have been broken.  Considering transportation specifically, analysts are publishing research on megatrends that attempt to explain the fact that cars are not returning to the road.  Several variables have been implicated:
  • Urbanization
  • Work force participation
  • Demographic shifts
  • Technology
  • Changing attitudes
  • Lifestyle changes

Whatever the cause, and if such a trend continues at all, the second order question for the energy sector is the impact on fuel consumption.  This requires consideration of fuel economy trends as well.  

A high level perspective may be helpful in separating the major issues from the minor ones.  The DOT recently released vehicle miles data for December 2013.  Because there is high seasonality, and weather sensitivity in winter, it isn't safe to conclude much from monthly data, but in general the release is consistent with a low/no growth trend in miles driven.  


Further analysis of the details indicates that interstate driving (both urban and rural) has been trending down vs arterial and surface street driving, but only slightly.

Most of the underlying trends that are blamed for the stagnation in miles driven are unlikely to reverse.  The primary exception is workforce participation, which is at historic lows and could recover substantially.  

The trends in fuel economy are also inexorably toward higher efficiency.  Wide variations in estimates for mpg improvement are muted by the slow penetration rate of new vehicles into the large existing vehicle count, and by the longer life of newer vehicles.  Projections also require assumptions about the future price of gasoline, adding uncertainty.  

Here are a few relevant data sets.


Observations:
  • Average mpg increase from 1990 to 2006:   +2.2 mpg (not much)
  • New car mpg increase from 1990 to 2006:   +2.1 mpg  (not much)
  • From 2006 to 2012, new car mpg increased +4.5 mpg (much)
  • The impact on fuel consumption, if average mpg rose by 4 mpg, would be a decline of about 1.2 million barrels per day of gasoline, or about a 15% decline.
So without speculating too much, the fact that mpg is improving at an increasing rate plus a 5 year stagnation in miles driven does suggest that unless Americans begin hitting the road again soon, the gasoline consumption trend has to head downward and could decline a long way.  

Naive logic suggests that a few other points may be axiomatic:

  • If one drives very little, mileage is a less relevant cost of ownership
  • If one drives very little, a vehicle could last half of one's driving lifetime
  • If gas taxes pay for road construction and maintenance, increased taxes may be required to maintain revenue.  That could become a self reinforcing cycle that keeps gas prices high in a variety of scenarios.
  • Energy independence, from a liquid fuels perspective, could be achieved even in a domestic peak oil scenario.


Nuclear Power Output Continues to Fall with Refueling Outages

Nuclear power plant output continues to decline, but tracking slightly above 2013, as more reactors come offline for scheduled refueling:


PDF Version

Severe Cold Pushes Degree Day Forecast To Extremes Again

NOAA expects the current week to deliver +40 gas-weighted HDDs this week, after unusual warmth last week held HDDs to 23 fewer than normal.  As the variance graph shows, only two weeks in 9 have been warm thusfar in '13, and the current winter now looks to set a few records.


Saturday, February 22, 2014

Mexican Oil Production Declines Again in January

Pemex reported oil and gas production for January 2014 yesterday.

Oil Report
Gas Report

Oil production fell about 2% vs last January.

Natural Gas was up slightly vs prior month, and continues to trend upward since May 2013.

Domestic sales volumes of Gasoline and Diesel continued to decline.


Friday, February 21, 2014

Rig Counts: Oil +2 Gas +5

Baker Hughes Rig Counts released today.

PDF Reports
Rig Count Summary
Basin Rig Counts
State Rig Counts
Canada Rig Counts


Oil Rigs
U.S. Oil Rigs were up a net +2, with larger changes by rig type.  No net increase in rig power, as only Verticals increased.


Oil basins were mostly little changed except for the Permian and Mississippian:


Gas Rigs
No gas basin rig counts changed by more than 1 rig, with the exception of the Marcellus which gained 2 Horizontal rigs.

Western US Hydroelectric Generation: Quantifying Drought Impact

Low reservoir and river levels, and low snowpack in the western United States portends low hydro generation for the spring and summer runoff season.  The forecast has improved in the Pacific Northwest and the Colorado River Basin, but not so much in California and the Sierra Nevadas.  There is still plenty of time for the situation to worsen or recover.

The PNW is by far the largest contributor to hydro power generation, and the Bonneville Power Administration (BPA) rules over it, and the Columbia River is the main driver.

Hydro generation in the BPA region has historically varied a lot.  Here is a visual of this year's hydro output, and the comps for '12 and '13.  The spring and early summer are prime time for BPA hydro, which exports most of that power to California.  Forward power prices in Cali are currently indicating that hydro will not be abundant this summer.


The Colorado River Basin is fed by snowpack that was underperforming until recently.  The Lake Powell Water Database maintains this lovely graph of snowpack, and the Blue Line (current season) is now above average, indicating a strong runoff season.  Reservoir levels are quite low, so nothing will be spilling over the dam, but hydro should keep up.


And California hydro is off to a low early start, down about 1GW on average so far this year:


Thursday, February 20, 2014

Solar Cycle

In 2008-9 there arose a concern about solar dimming, when the normal sunspot cycle went through a two year aberration, producing far fewer sunspots (and less solar energy) than expected.  Various theories arose as to why, and whether this was the start of a long solar minimum that could rival either the Maunder or the Dalton Minima in the historical record, both of which were correlated with abnormal and prolonged cold.

Sunspot activity resumed in 2010, but at a lower than normal level.  Here is a visual record of the sunspot data series from 1950 through Feb 2014, indicating that we are in the smallest cycle of this period, though it is not clear whether the cycle has yet reached its peak.


EIA Weekly Petroleum Status Report: Oil Inventory +.973 Gasoline +.309 Diesel -.339

In the weather affected week ending Feb 14, the EIA reported petroleum inventories, supply, and demand today (late due to President's Day):


  • Commercial oil inventories rose 973K barrels to 362.3M (middle of range)
  • Gasoline inventories rose 309K barrels to 233.4M (upper end of range)
  • Distillate inventories were down 339K barrels to 112.7M (below low end of range)
  • Cushing inventories fell solidly again by 1.733M barrels:

  • Crude oil production was up again to a new record 8.148 Million barrels per day:

  • Gasoline demand for the week was below the 5 year range at just 8.03 MBPD


Full PDF Reports:

EIA Petroleum Inventory
EIA Petroleum Supply
EIA Petroleum Demand (Product Supplied)


Natural Gas Storage Report: Inventories Down 250 BCF to 1,443 (and a prior week revision)

The EIA released working natural gas storage inventories this morning:

  • Inventories declined 250 BCF, slightly less than expectations.  Futures initially fell on the news.
  • Inventories for the prior week (Feb 7) were revised upwards by 7 BCF (all in the Producing region).
  • The storage deficit increased vs 2013 to -975 BCF.
  • The storage deficit increased vs 5 Year Avg to -741 BCF.
  • At 1,443 BCF, inventories are on track to bottom out near 1,000 BCF in March.


Salt dome storage in the producing region continued to fall disproportionately:


Not much change to the projected season-ending inventory, up slightly to 976 BCF +/- 190 BCF:


Eagle Ford Shale: The Gas / Oil Mix

The Eagle Ford Shale is a potent component of the outlook for domestic oil and gas production.  Rapid development led to binding constraints in drilling and completion resources, and takeaway and processing capacity.  With dry, wet, and oil windows, the production mix shifted.  Rigs moved north (to oil) as gas prices went south.  Rig classification is also ambiguous.  Now it would seem that it is all about oil.  With the gas rig count down near 30 and the oil count just shy of 200, the production mix should already be reflecting that shift.  Look again at the rig count trend in the basin:

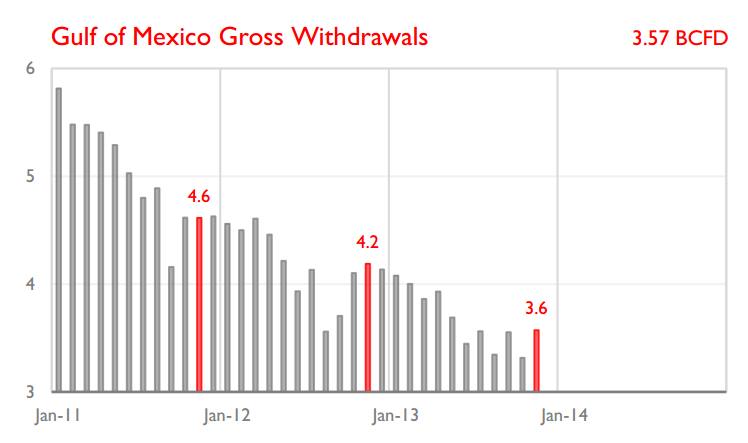
But gas production is still rising for the moment, and the EF counties are producing around 6 BCFD now.  But just as audiences love an imperfect hero on the stage, the EF seems always to be mixing substantial oil in with the gas wells, and gas in with the oil.  And in a play where rigs are so fast and productive, could gas production still grow meaningfully through oil wells?  

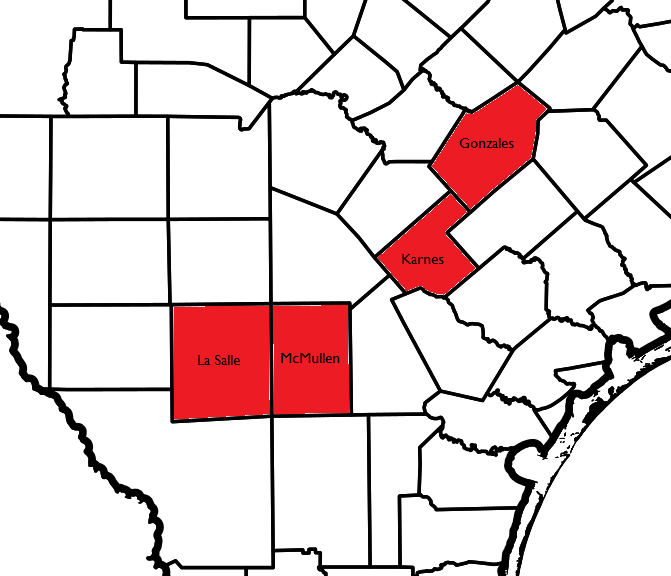
To get an initial bearing on the question, a county like Karnes is useful to analyze.  It is in the heart of the play, has over 1,000 EF well completions, covers both the dry gas, wet gas, and oil windows, and has strong drilling activity (around 35 rigs currently).

Here is the TX RRC map of the EF with Oil and Gas completions.  Karnes is at the core, circled in yellow:


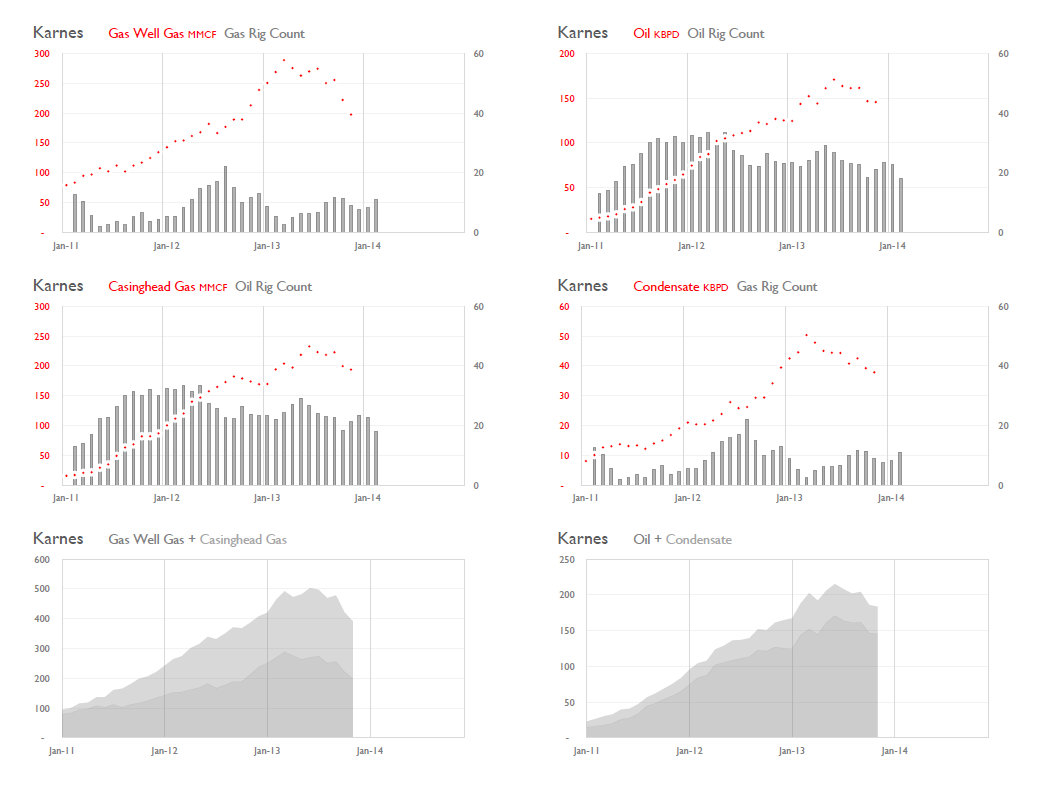
Texas classifies all producing wells as either Oil or Gas.  When a well is classified 'Oil', the liquids are coded Oil and the associated gas is coded Casinghead Gas.  When a well is classified 'Gas', the gas is coded Gas Well Gas, and the liquids are coded Condensate.  With that in mind, here are current production statistics (though not complete for many months, as some production is reported late) for Karnes County, along with the average gas and oil rig counts by month (from Baker Hughes).  


It is best not to set much significance by the apparent production declines in recent months.  Those are temporary, with more production to be reported for those periods over time.

An examination of gas wells in Karnes county reveals that their production has been getting oilier over time, rising from about 40% condensate (by BTU equivalent), to over 50% in the past three years.  But oil wells, of which there are many more, have produced a steady 19-20% Gas since early 2012.  If oil wells in this area continued to generate a 4:1 oil:gas ratio, then oil wells would likely have gas reserves near 1 BCF per well.  That would point to a gas rig equivalency in the range of 5-10 oil rigs = 1 gas rig.  That's still a wide range, but it would suggest that 200 oil rigs are developing as much gas as 20-40 gas rigs.  This cannot be extrapolated to the entire play without much more analysis, but it suggests that a 2 Million barrel a day oil output target could support 3BCFD in associated gas supply.  

Wednesday, February 19, 2014

Natural Gas Production Outlook

Low gas rig counts and inventories appear to be driving a rally in near month gas prices as cold weather lingers.  But the forward strip beyond 2014 is not moving up.  Much has been made of the fact that virtually every producing basin is in decline, excepting the Marcellus/Utica and the Eagle Ford.  But consider another angle on the same data:  The net gas production growth in the last three years was the result of swelling tight gas performance offset in part by steep declines in other major legacy basins.  Those steep declines are not going to continue because they can't.

The overall massive increase in gas production:


Meanwhile, output from the Gulf of Mexico, Louisiana, and Wyoming have combined for a loss of about 6.6 BCFD from their respective peaks in that same time frame.


Louisiana has been the largest contributor to the decline, with the Haynesville almost cut in half from its peak output.  As these basins stabilize (or even continue their declines at the same %), there will be far fewer legacy production losses offsetting further growth in the top shale basins.  And there is the potential that the Gulf could return to a production growth path, as long lead times for projects that were interrupted by the Macondo incident are completed.  

If the current rally in gas prices begins to infect the forward strip, marginal shale plays like the Haynesville and even the Barnett will likely see some recovery in activity, with so few rigs working now.

This is not to suggest that production is guaranteed to skyrocket, but it does indicate that the sources of production growth could still drive national production increases without sustaining the steep output trajectories we have seen in the early years of development.

Nuclear Power Plant Refueling Begins, Output Falling but Remains Above 2013

With nuclear power output declining in earnest due to scheduled refueling, a further loss of 8-10% of output is expected over the next 8 weeks.  The graph shows 431 GWh more output than in '13 over the trailing 7 days, a natural gas equivalent of about 3 BCF in total.


Tuesday, February 18, 2014

Pennsylvania Reports Oil and Gas Activity for 2H 2013

Pennsylvania Dept of Oil & Gas released semi-annual drilling and production report for Jul-Dec 2013.  Among the highlights:


  • Unconventional well count increased 351 to 7,027
  • Average daily gas production for the half increase from about 7.8 BCFD in 1H to 9.2 BCFD in 2H
  • Chesapeake again led the field in operated production, up from 1.69 to 2.04 BCFD


Here are the top 25 Operators (by gas volume) and their respective gas output and well count:


Here are the various ways PA classifies the unconventional wells.  (For a well to be classified as Producing, it has to have reported production in the period.)

The challenge of determining how many wells are part of the backlog of uncompleted wells is not completely clear.  PA wells can be classified as Non Producing, and/or Inactive. Inactive wells are very few (401 above), but Non Producing wells are many (2,111 above).  Most Non Producing wells have a narrative comment in a separate field of the spreadsheet.  Two comments predominate the list:  Drilling Not Completed and Temporarily Shut-In.  Here is the breakout of those:


Haynesville Shale Production Analysis

With natural gas prices moving back into a range that some consider marginally economic for Haynesville drilling, it is worth a look at what has happened to that basin.  Both Louisiana and Texas publish production  data by county monthly.  Louisiana data is relatively complete after about 4 months, but Texas data tends to be revised upward due to late reporting for about a year, with most recent months being grossly incomplete.

With that knowledge, it is still meaningful to review incomplete production data, and the monthly production numbers included here are on an as-reported basis through Feb 15, 2014.  Important also to note that these are county/parish totals, which will include material amounts of legacy/non-haynesville production.

Rig activity has been flat to slightly upwards on both sides of the state line.  De Soto Parish, LA has historically represented about 50% of all Louisiana Haynesville production, and it still does.  It also hosted 13 of the 20 gas rigs that were targeting the LA Haynesville in Feb 2014.

Louisiana has always produced more Haynesville gas than Texas.  Panola County is the largest Haynesville producer on the TX side, and has been averaging about 15 gas rigs in recent months, per Baker Hughes.

Full County by County Analysis in PDF