Nationwide, cooling demand is rising this week to slightly above normal. Some larger increases will be seen in gas burning markets of Texas, Louisiana, and Florida. No cooling demand is expected yet in California this week, where power demand is at multi-year lows.
Monday, March 31, 2014
EIA: Natural Gas Gross Production Report
Today's EIA Natural Gass Gross Production Report showed strong production despite the known freeze-off related production problems in several regions in January:
NOAA: March 29 Week was Extremely Cold. April 5 Week Mild
Large swings in weather, and weather related energy demand, at the end of March. 167 Heating Degree Days were recorded, against a normal of 128. This was close to the 169 HDD recorded for the week ended Feb 22, in which 95 BCF was withdrawn from natural gas storage. The current week should record a smaller gas withdrawal, since the NOAA weather week ends on Saturday, and the EIA gas week ends on Thursday.
The forecast week, ended April 5th, shows a milder than normal 101 HDD forecast, against a normal of 114.
PDF Report
Western Canada Natural Gas Storage Withdrawals Still Exceeding 2013, Production Grows
TransCanada Alberta continues to show daily withdrawals from natural gas storage, despite a switch to storage injections by this time in each of the last two years. This is increasing the storage deficit and should lead to much lower exports to the US throughout the summer.
Some producers are reporting that maintenance related pipeline pressure reduction notices have been received from TC NOVA in northern Alberta, suggesting that pipeline receipts could be curtailed by as much as 400-500 MMCFD until further notice.
Here is an example from Questerre Energy last week (highlights added):
The Company reported that on March 25, 2014, it was advised that the National Energy Board issued an order requiring Nova Gas Transmission Ltd. ("NGTL"), a wholly-owned subsidiary of TransCanada PipeLines Ltd., to implement pressure reductions on a limited number of pipeline sections. This will materially reduce transportation of natural gas at 26 receipt points in Alberta, impacting approximately 400 MMcf/d to 500 MMcf/d of production in the province. NGTL has advised that it is working diligently to expedite remedial work on the affected pipeline sections and restore full service as soon as possible. As a result of this order, Questerre's production in the Kakwa-Resthaven area is currently shut-in by 50%. Questerre is awaiting further information from NGTL regarding the length of the disruption to its production.
Some decline in Alberta field receipts is possibly observable, though volumes recovered a bit over the weekend.
Through the winter, withdrawals from storage have now exceeded last winter by 194 BCF.
Nuclear Power Output Rises, Now Generating ~75GWh Above 2013
A wave of nuclear power reactors returned to service over the last three days, pushing output to levels well above 2013. The surplus generation would theoretically equal more than 1/2 BCFD of natural gas displacement.
The nuclear refueling season still has weeks to go before the fleet is operating at/near capacity to meet summer cooling requirements.
PDF Report
Sunday, March 30, 2014
Haynesville Shale Natural Gas Production Trends
Most Haynesville area producers have reported production results for January 2014. The word most is critical here, as it leads to the opposite conclusion that all would. Rig counts have been very low but stable for a year and a half on both sides of the (TX/LA) border, but production has been trailing off without cease since late 2011.
With rig and well productivity trending upward in the industry for years now, a naive logical hypothesis would be:
Production will eventually stabilize and perhaps begin a slightly upward trend if rig counts remain stable in the Haynesville.
But the Haynesville has been a popular whipping boy for so long that it has become axiomatic to illustrate 'terminal decline' of mature and/or uneconomic plays, and the steep decline curve of tight gas.
So. This is probably going to be wrong. In 2014.
Preliminary data show that January 2014 is probably going to be flat with December 2013. The volumes reported in the first 60 days after a period are a reliable fraction of the final total, and the initial reports from Texas and Louisiana are rather higher than would be typical if gas production declines are anticipated. These production numbers are going to be steadily revised upwards week after week, as they always have been in the past. (see notes at the bottom of this post).
The visualizations below show that:
- LA reports 3.346 BCFD for JAN, vs 3.944 BCFD for DEC
- TX reports 1.978 BCFD for JAN, vs 2.062 BCFD for DEC
PDF Report by County/Parish
Notes:
- Reporting practices and trends for each state differ materially, and until final numbers are in (which can take over a year in TX, but much less is LA) the verdict cannot be pronounced.
- The data is foggy for other reasons...it includes all gas production, which includes legacy production, associated gas production, and production from other formations...but those are not very big numbers nor do they tend to vary much from month to month. The gas rig count, too, can be skewed by rig classification variances, mainly an issue on the Texas side of the border, since few oil rigs are working in LA Haynesville parishes.
- The production data comes from: Texas RRC Louisiana DNR
Seeing the Impact of Distributed Solar Power in the West
As more rooftop solar (residential and commercial) is deployed in California (the leading state for distributed solar capacity, by far), the impacts are being seen on the grid.
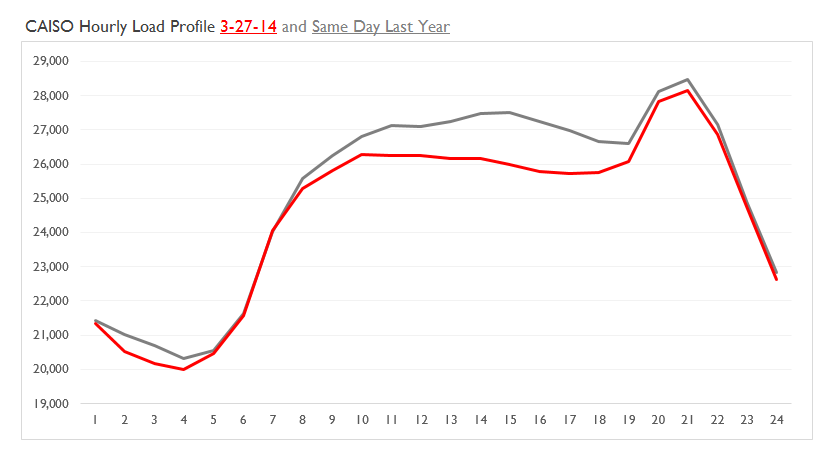
The solar generation hours (between 7am and 7pm in March) are showing a marked decline in load profile. Here is a typical example, from Thursday March 27, 2014 compared to Thursday, March 28, 2013. The difference in peak load is only about 300 MW, but the daytime difference peaks about 3pm at 1,500 MW.
It does not require an advanced degree to see where this is going, nor to see what the impact on peak load would be if battery storage rolls out in sufficient quantity to store some solar power for about 5 to 6 hours (economically).
Saturday, March 29, 2014
Northwest Hydro Output Suppressing Fossil Fuel Use in March
The rapid reversal of the dry conditions in the pacific northwest has fueled a surge in Columbia River flows and snowpack. Bonneville Power Administration data shows that hydro generation has exceeded 2013 levels by over 5GW in the last three weeks. This excess has translated into more power headed south to California and less thermal (coal and gas) generation within the BPA system.
Here are the 7 day trailing averages in Hydro, Exports, and Thermal Generation. The historical patterns indicate that the gains won't persist at these levels through summer.
Friday, March 28, 2014
Baker Hughes Rig Counts: Oil +14 Gas -8
A continuation of recent trends in today's Baker Hughes rig count. Oil rigs up 14 to a new high, Gas rigs down 8 to a new low.
The same trends were reflected in both the horizontal and vertical rig counts for each type:
PDF Reports:
Rig Count Summary
Rig Count by Basin
Rig Count by State
Canada Rig Counts
The same trends were reflected in both the horizontal and vertical rig counts for each type:
The two hottest oil plays, the Permian and Eagle Ford, continued to set the pace for rig additions, all on the oil side of the ledger, as their gas rig counts dwindle to nothing:
PDF Reports:
Rig Count Summary
Rig Count by Basin
Rig Count by State
Canada Rig Counts
Average New Vehicle MPG rises again in FEB
The University of Michigan reported fuel economy for FEB 2014 new car sales, which rose to a new highs.
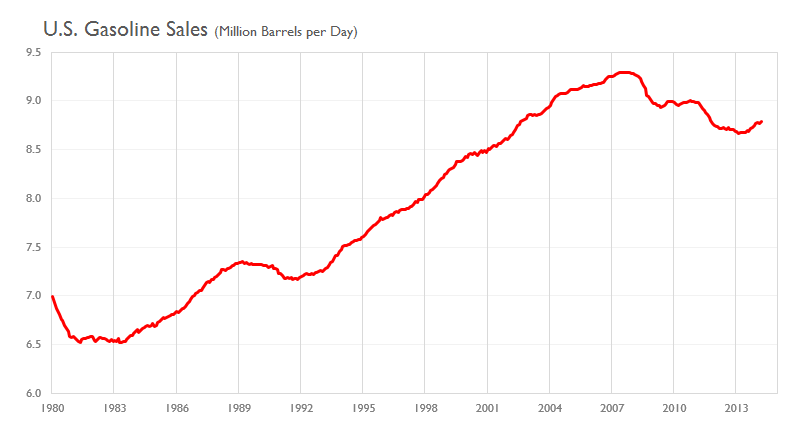
Since total miles driven has remained flat for almost four years now, the rapidly improving fuel economy of new vehicles should increasingly result in lower domestic gasoline consumption. US gasoline sales have reflected this so far (see the 12 month average gasoline sales graph below). But alternatively we may also see an increase in miles driven, as employment picks up and the economy improves generally.
Fall 2014 Natural Gas Inventory Projection: 3.25 TCF
As natural gas inventories look to exit the season in the low 800's, high gas production and lower power generation demand should loosen the supply/demand balance through the shoulder season. But the massive inventory deficit is unlikely to refill by autumn, because a tighter gas trade balance and the impact of coal plant retirements should tighten the market as summer demand materializes.
Here are the key variables in the inventory projections, and the expected monthly levels relative to 2013. Canada will be forced to redirect exports to refill its own domestic inventories, and the broad consensus is for Mexican demand to increase by 200-300 MMCFD. Production and Electric Generation demand are less certain, with weather and pipeline projects have an impact on the timing and extent of any increases.
These projections show autumn inventories peaking at < 3.3 TCF, a level that will likely provide support to summer gas prices. Mild weather and swelling production are the bearish risks to gas prices in this scenario.
Thursday, March 27, 2014
EIA Natural Gas Storage Report: -57 BCF Withdrawal
Working gas in storage fell to 896 BCF as EIA announced a 57 BCF withdrawal for the week ended March 21.
Natural Gas Storage Report
March 2013 had extremely cold weather, so storage variance did not move much, still holding at about 900 BCF below last year and the 5 year average.
With weather close to normal (slightly cooler), but much warmer than 2013, salt dome storage recovered slightly (+3 BCF), while non-salt storage fell solidly again by 18 BCF to just 311 BCF.
Colder weather was forecast by NOAA for the current week (156 HDD vs 152 HDD):
This makes another large withdrawal likely next week, reducing inventories to a seasonal low below 850 BCF as we exit March.
Natural Gas Fired Electricity Lost Market Share to Coal as Prices Rose in 2013 and 2014
Despite a cold January this year, and accompanying high electricity loads, natural gas lost out to coal fired generation. Gas has shown significant price elasticity, especially during the spring shoulder season, where YOY pricing has risen drastically from 2012 to 2014. And this in the face of what has clearly been a structural shift toward gas fired new capacity and coal retirements.
Few new coal retirements are scheduled in 2014, but a substantial volume will shut down as MATS is implemented through 2015. Some of the largest new capacity additions are coming in Ohio and Florida.
Here are the gas vs coal market share patterns in both those states recently. Quite a difference in coal dependency. Gas already dominates in Florida, while Ohio is coal dependent as expected. Florida has seen coal retake significant market share of fossil fuel powered electricity generation.
Another data point from the south too, Southern Co reports these operating stats for Q4 2013, showing a definite decline in natgas in favor of coal:
However, they are (somewhat) optimistic about 2014 growth:
Wednesday, March 26, 2014
EIA Petroleum Weekly Report: Crude Inventory +6.6 M, Gasoline -5.1 M, Diesel +1.6 M
Inventories
Crude inventories rose sharply in the week ended March 21st, by 6.619 MMB. A further decline in Cushing, OK crude inventories set a new 6 year low for this week, but the crude is accumulating on the gulf coast, where inventories rose 6.061 MMB.
Gasoline stocks fell more than 5 MMB, while Diesel stocks rose modestly (by 1.56 MMB).
PDF Report: EIA Weekly Petroleum Inventory
Demand
Gasoline demand rebounded from last week's sharp decline, moving to the high end of the historical range, above 9 MMBD. Diesel experienced the opposite, falling sharply to 3.48 MMBD, below the historical range. Demand fell in most other categories to pull total product supplied lower by about half a million barrels per day.
PDF Report: EIA Weekly Petroleum Demand
Supply
US production fell by 2,500 barrels per day last week, while net imports rose.
PDF Report: EIA Weekly Petroleum Supply
2013 Annual Electricity Generation and Market Share
Preliminary numbers from the EIA for 2013 show the twin threats to coal and gas-fired electricity generation: Slow power demand growth, and small but steady gains by renewable fuels.
In 2013 total power demand was flat with 2012, and well below the 2012 peak (by about 2.5%). Power generation from fossil fuels fell by about 1.6%, with a corresponding gain for renewables+nuclear.
While 2014 is showing signs of load growth in a few regions (Texas in particular), renewable capacity is likely increasing by the largest amount ever, and expensive natural gas is also losing market share to coal.
This output plateau bares an interesting resemblance to the trend in total road miles driven, which stopped growing during the economic crisis and never got back on trend.
Miles Driven in January Declines to Lowest in 3 Years
DOT statistics for miles driven in January 2014 were released this week, and showed a significant decline in total miles driven, month-to-month and year-on-year. The weather was such a significant factor that it is difficult to discern any other trends.
The 12 month average:
- Miles driven in January were down about 3 percent from the prior Jan, and the lowest in three years.
- The trailing 12 month average miles driven was up slightly.
- The trailing 12 month average also continues to show a very slight trend toward more highway miles and fewer 'other' miles.
The 12 month average:
Tuesday, March 25, 2014
Alaska North Slope Oil Production Holding Steady, Down 4.3% YOY
As summer maintenance season approaches, bringing field shutdowns and erratic swings in production data, the story thus far in 2014 reveals a net 4.3% decline vs the same period in 2013. That is a bit steeper than last year's full-year 2.9% decline, but flatter than the 5%+ declines in 2011 and 2012. Production has been close to 542K BOPD recently.
See the PDF Report for field by field data, which details the improved field performance at Kuparuk, offsetting declines at Prudhoe and Alpine.
Western U.S. Hydro Power Update: Overall Conditions Improving
Hydro power output in the western states continues to outpace last year, and the stream flow forecasts are improving overall.
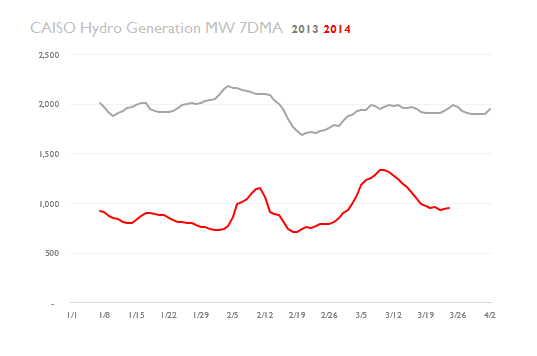
California hydro output is still running about half of last year, but that is only a loss of about 1,000 MW of output.
The pacific northwest (BPA region) is running at more than 5,000 MW above 2013.
Meanwhile the BPA stream flow forecast is now at 106.6% of normal as of yesterday:
Stream flow forecasts are still very low for the Sierra Nevadas, but they were very low last year as well. In the past week the snowpack has deteriorated noticeably (early melt plus less precip):
Last week: 27% of Norm This week: 23% of Norm

The snow pack in the Colorado River Basin is still at about average, with four weeks left before melt normally begins.
Last week: 27% of Norm This week: 23% of Norm

The snow pack in the Colorado River Basin is still at about average, with four weeks left before melt normally begins.
Pemex: FEB Oil Production Declines 5k bopd, Nat Gas Production rises 85 mmcfd
Pemex reported operating statistics for Feb 2014 yesterday:
Oil production was down again slightly, to 2,501 kbopd. However NGL production rose by 15 kbopd, lifting total liquids production by 11 kbopd from JAN.
Pemex Oil Report PDF
Natural gas production rose for the 9th consecutive month, by 85 mmcfd to 6.545 BCFD. That volume has only been achieved once in the last two years. The growth came primarily in hydrocarbon associated production offshore.
Pemex Gas Report PDF
Nevertheless, natural gas imports also rose as domestic consumption continues to grow.
Monday, March 24, 2014
Slow Start to Air Conditioning Season
The faint beginning of cooling season will not register on the scales of natural gas demand in the week just ended, with total US CDD at 3 vs 5 Normal. Of the major gas burning states, only Florida is above average with 39 CDD vs 33 Normal last week. Last year this week was also immaterial, at 4 CDD nationally.
Electricity use last week should still be above average, due to persistent cold weather.
Subscribe to:
Posts (Atom)


