Pages

Friday, January 31, 2014

Utica Oil and Gas Drilling

The Utica Shale is growing more quickly than any other shale in North America.  It is predominantly in Ohio, and Chesapeake is the dominant operator.  Three key questions have been:  How prolific?  How Oily? and Where is/are the sweet spot(s)?

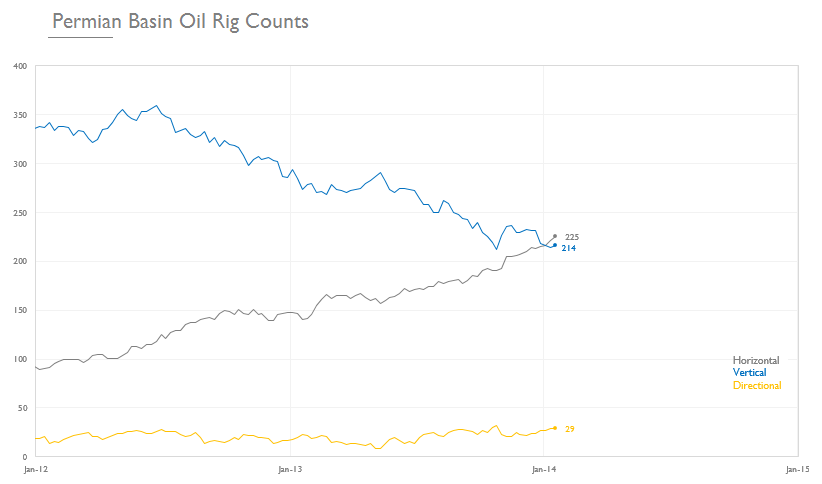
Oil is a more popular label than gas these days, at least for publicly traded operators.  Look at the Ohio rig counts below.  Oil rigs were the anchor until May of '13, when a dozen gas rigs arrived.  The State of Ohio has only released production reports through Q3 of 2013.  Judging from the rig counts, one would expect the production to be very oily.


But not so.  The Ohio Q3 report shows production is predominantly gas.  Here is the production by county, and by operator:


It indicates that the Utica is going to be very gassy, unless operators can somehow target oil.  It appears that Harrison and Carroll counties are the most oily, at 60-80% gas.  Let's look at where the rigs are working today.  (The rigs are not accurately placed within the counties).  Rigs classified as Oil and Gas:

U.S. Rig Counts Oil + 6 Gas + 8

Baker Hughes Rig Counts showed gains on most fronts this week.  Highlights:

  • U.S. Gas rigs were up 2 but gas horizontals fell by 2
  • U.S. Oil rigs gained 6, with horizontals up 5, directional rigs up 8, and verticals down 7
  • The Permian continued to replace vertical rigs with horizontals, though overall count was down 3
  • The Utica hit new highs, adding 2 rigs to 40.  This put Ohio at 38 rigs, catching up with PA (55)
  • Canada continues to trend opposite U.S. in drill target, with Oil down 69 from a year ago, and gas up 52.
  • Both the U.S. and Canada have 75% of the oil rig fleet in horizontals, but the gas fleet is almost entirely horizontal.


Western Canada Natural Gas Storage and Production

With ongoing cold weather in the US, Canada continues to ship gas southward in high volume.  It is depleting storage quickly in Western Canada, as Transcanada daily reports show.  Alberta production is above last year, but not dramatically (less than 1/2 BCFD up), and storage withdrawals are outpacing last winter by 107 BCF, a meaningful deficit.


Thursday, January 30, 2014

Natural Gas Inventory: 230 BCF Withdrawal

The EIA reported natural gas inventories were down 230 BCF in the week ended Jan 24.  This was close to expectations, judging from the muted reaction in the futures market.

This puts storage 637 B below last year, and 437 below the 5 year average.  With anomalous cold forecast for the next 3 storage reports, storage will likely end between 1.4 and 1.5 TCF after the Feb 13 reporting week.  5 year average withdrawals from that point onward would bring storage near 1 TCF by the end of winter, more than 600 B below '13.  


View Full Report (pdf)

Alaska North Slope Crude Oil Production

The State of Alaska publishes daily oil production statistics by field for the North Slope.

Significance:

  • 90% of state revenues come from oil tariffs
  • Declining production threatens viability of the pipeline below certain thresholds in winter
  • Changing tax regime in the state is expected to stimulate production
  • The state has consistently underestimated decline rates for budget purposes in the past
  • Many wonder how much oil remains economically recoverable 

Download Full Report


Wednesday, January 29, 2014

Texas Oil and Gas Drilling and Permitting

Since almost half of the U.S. land rig count operates in Texas, it is useful to review the Texas Railroad Commission Monthly Drilling and Completion Summary.  The reports are issued within ten days of month end for the previous month.  (See NB below the chart).  December 2013 highlights:


  • After nine months where drilling outpaced permits, more new drill permits were issued (1,472) than well completed (1,410).
  • Gas completions were flat MOM, at a low level (129), after averaging 443 per month in MAR-OCT.  Other than the Barnett, where dry gas drilling fell off noticeably in '13, it is likely that operators are coding many of their completions as oil based on prevailing economics.
  • Total completions were down, typical for DEC but continuing a steep downward slope since reaching a high of 2,738 in MAY.  


NOTA BENE:  New drill permits in Texas are of 3 kinds (Oil, Gas, Oil+Gas), but completions are either Oil or Gas.  This ambiguity leaves the discretion to the operator, and in basins such as Eagle Ford and Granite Wash, well production can include substantial volumes of both oil and gas.

Download this report as a PDF

Weekly Petroleum Report

Today's EIA Petroleum Weekly release highlights:

Crude +6.42
Gasoline -0.82
Distillate -4.58

Continued strength in distillates brought inventories further below the 5 year range:


And distillate demand clocked the highest single week in six years:


No major changes for crude at Cushing +0.24:


Tuesday, January 28, 2014

Nuclear Power Status

Nuclear power output outpaced 2013 in January, by about 2%.  The spring refueling season will begin for about 30 reactors over the next 2 weeks.  The increase in output over January of 2013 would theoretically have displaced about 9 BCF of natural gas fired power generation.Only three reactors are currently reported offline....Beaver Valley#1, Palisades, and Monticello.


Monday, January 27, 2014

Quantifying Weather Effect on U.S. Heating Demand

Weather anomalies continue to run cold, and the actual results for NOAA WEEK 4 (Jan 19-25) were colder by far than their previous forecast.  The current week's forecast is for less intense cold, with Gas Weighted HDD's falling by 4 to 230, but still quite a cold anomaly over the normal 204.

The variance from 2013 is even greater, at +58.


Natural Gas Production Reporting in Texas

Skeptics of the shale gas revolution sometimes reference Texas Railroad Commission production reports to support the argument that gas production is in decline.  There is a large discrepancy between EIA reported production volumes and state reporting.  But the methodology is quite different, and the EIA uses a correction factor for more recent months to account for unreported volumes.  The RRC does not, and the result is the appearance of declining production when in fact production is growing.

As of today, here are the volumes reported by each agency.  Over time, the same thing always happens.  Late production reports add to the volumes reported by the RRC,and the tailing curve rises to track the EIA number.  


Sunday, January 26, 2014

Rig Counts: Oil +8 Gas -9

While natural gas price spikes were making news Friday and weather was the primary driver, Baker Hughes released the rig counts for the week, and gas rigs fell further.  Basin by basin, the total oil and gas rig counts were noteworthy for:

Rig Count Highlights
  • Permian rigs are +20 in a year, but horizontals are up an astonishing +83, while verticals have declined by 69
  • In the Williston Basin, the past year has seen a fleet of directional drilling rigs deployed
  • Eagle Ford rigs were down 9 this week, to a still high 216 (191 Horizontal)
  • The Haynesville rig count was flat this week, up 2 in a year, but the horizontal count is +6 YOY, a significant percentage increase in rig power.


Saturday, January 25, 2014

Western Canadian Natural Gas Production Rising?

The production of Natural Gas in Western Canada has been steady, with perhaps a slight decline, for the past two years.  Most forecasts have indicated it will remain within a tight range in the coming year.  However, the gas rig count in Alberta has been rising steadily (the oil rig count has fallen modestly), and the reports from producers indicate that efficiency and reserves per well are increasing.  Furthermore, the advent of pad drilling should reduce the downtime in spring due to road conditions.


Most Western Canadian production is in Alberta, and the TransCanada NOVA pipeline system reports field receipts daily online.  Using it as a proxy for total supply, here are the YOY comparisons.  Note that field receipts are rising in January.  This may be explainable by temporary factors (previously shut-in supply returning due to higher prices, flush production after winter freeze-offs, etc..), but it may also herald the beginning of rising production.  It would be surprising that a horizontal rig count of over 100 would not soon show itself in rising output, by analogy to the U.S., where output of over 65 BCFD is sustained with a rig count of only 300+.


Historically, Alberta production has not shown much of a seasonal pattern, with the exception of a slight decline in Q3 that lags the annual Q2 rig count decline.  

Friday, January 24, 2014

Hydro Power Deficits in the Western US in 2014

The drought and accompanying low snow pack are making headlines in California.  Many basins are tracking below normal snow, and most reservoirs are already low.  Key areas to watch are the Columbia River Basin, the Sierra Nevada, and the Colorado River Basin.  

The effects of low precip will be felt later in the spring, and low volumes will result in both a shorter and a lower runoff period.  Some early indications of lower YOY comparisons already occurring are in the Bonneville Power Admin, and California's CAISO generation data.  Here is how the current year is stacking up to '13 so far in January:


Output has so far been running about 3GW light in the BPA region, and about 1GW light in California.  Likely similar impacts in AZ and NE.  This has a large natural gas equivalent, and the impacts will be much more significant in the Spring/Summer if the drought persists.

To see the Colorado River Basin snow pack status, visit the Lake Powell Water Database snow pack graph


Thursday, January 23, 2014

Natural Gas Storage Falls 107 BCF

Similar to expectations, today's inventory fell 107 BCF to 2,423.  This puts January on a path to withdraw nearly 1 Trillion feet from storage and exit January with between 1.8 and 1.9 TCF in storage.

Large draws are expected for the next two storage reports, with significant cold ahead.  Today's weather report and inventory combine to lower the estimate of working gas in storage at the end of winter to about 1.1 TCF.  This should be very supportive of gas in the near term, but the forward strip will continue to trade based on supply expectations, as today's market data reflect.  While both February and March contracts were higher, April and beyond were trading just a few cents up.


Looking ahead to the prior year and 5 year comps, we see that they are going to be easy to beat, noting that they fall below -150 as we enter February:


Wednesday, January 22, 2014

Natural Gas Storage Headed Much Lower

The persistent cold weather across much of the US and Canada continues to pull gas for power generation and heating.  Forecast revisions continue to emphasize prolonged cold, which suggests that the US is headed toward a season end inventory level below historic norms.  

The Wall Street Journal reported yesterday that Goldman Sachs has lowered their inventory estimate from 1.6 TCF to 1.39 TCF.  This is still well above the level that normal weather patterns in Feb-March would suggest.  An inventory target closer to 1.1 TCF is still likely, as the US prepares to exit January with less than 2.0 TCF in storage.  As shown below, that target sits in a large range of outcomes, as weather can still vary significantly in Feb-Mar.  Furthermore, the price of natural gas may remain above $4.50 for the rest of the winter, which would reduce consumption (in the electric power sector).  This should make it difficult for gas to stay above $4.50 for long, unless further cold weather pushes the inventory target close to 1.0 TCF.


Marcellus Utica Rig Count Shift

As the Marcellus and Utica expand geographically, and transportation constraints persist in Pennsylvania, the rigs are migrating West and South:


  • Pennsylvania horizontals are down 50% from two years ago, to 50 rigs currently.
  • West Virginia horizontals are up 50% to above 30 rigs currently.
  • Ohio, where rig classification is an issue, has seen Oil+Gas horizontals rise to 29 from nothing.


Tuesday, January 21, 2014

Nuclear Power Status

Nuclear power plant output fell below 2013 over the weekend, as several new outages reduced generation.
Through the winter to date, nuclear power output was exceeding last year by a meaningful amount.  Now the comparisons are about even, which benefits natural gas fired generation.

The NRC reported data through today.  Here are the highlights at a glance:


Permian Basin Oil Rig Count Trends

Rig counts are growing gradually in the Permian Basin, but beneath the gentle slope of the total we find a more dynamic set of variables.  Horizontal rigs are growing fast, while verticals are in decline.  This week horizontal rigs overtook verticals:


Weather Driven Natural Gas Demand

After a cold NOV-DEC, January has been uneven.  The polar vortex came and went, with some warm weather in between.  A look at the Gas-Weighted Heating Degree Days shows that the 4 weeks in 2014 (including this week) are running about 7 HDD's above a normal 898, which is not so exceptional as the headlines would suggest.  The long term forecast looks colder than average.

Last year during the comparable 4 weeks, the US saw 57 fewer HDDs than this year.

Despite what should be three months of anomalous cold, natural gas is struggling to hold $4.  Inventories will be low as we exit winter, still aiming around 1.2 to 1.3 TCF, about 400-500 BCF below last year.

Here is the NOAA weekly weather data:      (PDF here)


Monday, January 20, 2014

Utica Shale Oil and Gas Production

As the most celebrated new shale discovery in the last few years, the Utica Shale in Ohio is being closely watched.  Both for volumes and for gas %.  The Ohio DNR Division of Oil and Gas has announced a quarterly publication schedule for drilling and production results by well statewide, and released the first report, for Q3 2013 (Here)

State's rights being what they are, it seems no two states issue reports that can be compared apples to apples.  The main things to note about the Ohio report are:

  • It's quarterly, and the production data are only in quarterly totals
  • NGLs are included in gas volumes
  • It reports by individual well (not by unit)
  • It does not indicate well status (ie producing or not)
And it is easy to answer just who has been busy in the play.  For those operators with few completions yet, the reported production volumes probably don't accurately reflect how gassy they production is yet.  

In total, about 42 BCFE in production was reported for the quarter, at 80.7% gas.  And it's dominated by Chesapeake:


Here is the same data sliced by County


Sunday, January 19, 2014

California Drought Effect on Hydro Generation

The high profile drought in California will affect many industries but with regard to hydroelectric generation, California depends more on imported hydro from the Colorado River Basin and the Pacific Northwest, both areas that are thus far less affected by drought.  

Here's a look at California's hydro generation to date in 2014.  It's running at about half the rate of last year.  To give perspective, total demand this time of year averages 550 - 600 GWh per day.  So hydro met about 10% of demand last year, and is current running more like 5%.  Fortunately, demand is down this season in California, and solar is picking up some of the responsibilities.


Saturday, January 18, 2014

Nuclear Reactor Electricity Ouput

The US nuclear power reactor fleet has been operating at a high capacity factor this winter, displacing alternative fossil fuel generation sources.  For the most recent EIA week ended Thursday Jan 17, the fleet operated at a level that would theoretically displace about 1.4 BCF of gas-fired generation, if gas were used exclusively.

The refueling cycle for about 30 reactors will soon begin, and output should begin falling in February, similar to last year.  Here are the generation and YOY comparison stats through yesterday, 1/17/14:


Friday, January 17, 2014

US Rig Counts Oil + 15 Gas + 8

Both oil and gas rig counts were up this week in the US.  But the gains were evenly distributed, with no major variances.


  • The Permian gained most, as expected this year, with 6 oil rigs added.  
  • The Eagle Ford lost 4 oil and gained 2 gas. 
  • The Niobrara gained 2 gas rigs and 2 oil rigs to reach an all time high.
To view the PDF rig count charts:  Oil Rig Counts   Natural Gas Rig Counts


Here are the notable changes by basin this week:


Comparing the Marcellus to the Haynesville

The last 8 quarters (2012-13) have seen 4,120 Well Spuds in the Marcellus (per the Baker Hughes Well Count Report).  By contrast, the Louisiana Haynesville Shale has a cumulative 2,281 producing wells (per the Louisiana DNR).  After the usual caveats (this doesn't include the much smaller Texas portion of the HVS, and the Marcellus total includes many wells not-yet-producing), the contrast is still stark:

The Haynesville Shale has seen fewer than 150 wells completed this year:


While the Baker Hughes report shows these well spuds by quarter:


It gives a sense of the enormous potential of this formation.  A full comparison must also include the relative recoveries (EUR) for wells in each basin, where the Marcellus outclasses the Haynesville by perhaps a multiple of 2.  And the future should hold more of the same, with the Marcellus Rig Count holding steady for the last six months, meanwhile rig productivity is steadily increasing.

Thursday, January 16, 2014

Record Natural Gas Storage Withdrawal -287 BCF

Today's announced withdrawal of -287 was a record but it disappointed expectations of -300.  Gas prices remain firm but did not rally on the news.  The structure of the NG Future Strip indicates that the primary concern is one of inventories, not supply and demand structurally.

Natural Gas Weekly Storage Report

Speculation that storage could drop to dangerously low levels by end of winter is likely driving the bidding for FEB and MAR contracts.  However, as winter is now past the midpoint, and the probability of supply-hampering well head freeze-offs declines (gradually), the focus will return to production.  The range of storage outcomes at the end of March is beginning to narrow.  My estimates still point to the 1.2 - 1.3 TCF range as shown, and the confidence interval is tightening to about 800 - 1,600 BCF.  That should narrow dramatically in the next two weeks, for all analysts as well.


Wednesday, January 15, 2014

More Rig Productivity Analysis

Here are profiles of major gas and oil basins using the Baker Hughes Well Count report.


EIA Petroleum Inventories

The EIA Weekly Petroleum Status Report was released on schedule this morning.
Inventories
Supply
Demand

Highlights:
  • New record high for domestic oil production, with Lower 48 production rising 20K barrels per day to 7.61 MMBOPD
  • 7.66 MMB drop in commercial crude oil inventories
  • Crude and Products Net Imports at very low levels again, implying an improving trade balance: 


Baker Hughes Q4 2013 Well Counts

Baker Hughes released their well count data for Q3 2013.  The report counts well spuds by basin, as well as average rig counts.  It does not distinguish between oil and gas, which reduces usefulness.

But the dry gas areas can be assumed to contain primarily gas rigs, and by comparing rig count averages in these basins with well spuds, an implied average drill time can be calculated.  The net result is that the big dry plays showed little if any improvement in rig efficiency:


Tuesday, January 14, 2014

Canadian Gas Storage

A follow up to a previous post on Canadian gas storage.  It was declining quickly in keeping with a rise in exports to the US during bouts of cold weather.  But Canadian domestic demand is up as well, both residential and industrial, and with production flat YOY, storage may continue its decline or exports may decline.

Look at the daily comparison of withdrawals this season vs last season.  This winter has seen a cumulative 95 BCF more gas withdrawn from storage.  Withdrawals are exceeding last year on almost every day:


Nuclear Power Output

US electrical output from nuclear reactors had been running well above the previous year in December, but as 2014 progresses, the gap is closing.  This is the daily graph, expressed in natural gas equivalent (at 135 GW = 1 BCFD).  As of today, output is about equal with last year:


Wind Power Gains in Texas

Texas is by far the largest generator of wind power in the US, and would be even further ahead but for transmission line limitations.  Gains were expecting in the new year as a number of transmission constrains were overcome, and more power brought on line.

Both California and Texas are worth watching closely as test cases for renewables integration, but for different reasons.  California has a large renewables mandate and a growing contribution from Solar PV.  Texas has less solar but substantial wind.  The EIA Electric Power Monthly data indicates the growth trend (and seasonality) in Texas wind generation.  The data are not yet available for NOV & DEC, but I used the ERCOT hourly wind generation reports to check on January progress in Texas.  Through the morning of the 14th of Jan, average generation is running well ahead of '13, up 44%:


With average peak hour generation normally around 40GW (varies substantially due to weather), it indicates that well over 10% of electricity generation in Texas is coming from wind in January.

A review of the hourly data indicates that wind output varies from over 9,000 MW to under 1,000 MW, a fact which captures the issue with wind, its variability.  Wind's second problem, unpredictability, is a subject for another day.  The official story says that natural gas fired power is the natural pair with wind, because it can be quickly cycled up and down.  An argument against that, for limits to that, can be made:


  • As wind gets larger and more distributed geographically, the high and low extremes will decrease, and when wind gets large enough, even the standby generation role of gas will result in less overall output (and gas consumption) from gas fired power.  


Monday, January 13, 2014

Weather Based Gas Demand

It has been a particularly difficult winter to analyze weather-based natural gas demand, especially to isolate it from the price sensitive electric power market and possible changes in gas production rates.

Last year started off quite mild and progressed colder, as shown below.  This winter began with a very cold Nov-Dec, including some record weeks, but also wildly fluctuating temperatures.  

Though last week's polar vortex (so called) set many records, the week as a whole was not so exceptional.  Yet a record gas draw from inventory is anticipated.  In fact, gas-weighted degree days were only +21 above normal, per NOAA.

It brings questions about how much structural change we may be seeing in heating demand per degree day, as well as regional issues with supply in the Northeast, and the effects of freeze-offs on supply.


We are in the middle of a very warm week now, and then a return to cold is anticipated.

Canadian NG Production

With the vast majority of Canadian gas drilling activity occurring in Alberta, the field receipts from Transcanada Pipeline in AB are a good approximation of total western Canadian production.

The fact that the Canadian rig count has been trending higher for some time, in contrast to the US count, could portend a divergence in the production trend as well.  No great indication of this yet, but the 2014 dailies are running a little higher than '13.

Look at both.  Canadian Gas Rig Count has been running around +50 for 2H of 2013.  Production has been steady, though recent volumes are slightly higher YOY.


Saturday, January 11, 2014

Haynesville Shale Production

Here is what the State of Louisiana reports for production from the Haynesville Parishes, and the corresponding rig count from Baker Hughes.  Often the most recent production months are revised upward for quite some time as late reports are filed with the state, but a clear and steady decline that exceeded most forecasts is evident over the last two years, falling around 3 BCFD from a peak above 7 BCFD.  (Note that the production totals include some legacy production that predates the haynesville discovery in these parishes.)


Friday, January 10, 2014

US Rig Counts: Oil +15, Gas -15

The Baker Hughes Rig Counts for this week showed Oil up 15, Gas down 15.  In the past, such a symmetrical gain/loss generated questions about rig classification.  A look at the details would indicate that it's only partially true this week.  Gas lost just a few rigs in most basins, and 5 rigs in the gulf of mexico.  In the Niobrara in particular, the oil count was +4, and gas -3, so those are probably the same pieces of iron.

Most of the classification issues are in basins with windows for gas, wet gas, and oil/condensate.  Where is that?  Utica, Niobrara, Granite Wash, Eagle Ford, and to some extent maybe the Permian.

Canadian rig counts are showing their usual seasonal recovery after a sharp dive over the holidays.  In general, Canada continues to show a marked increase in gas rig activity over the prior year.  Not so with oil.  There could be classification issues here as well, I have not investigated.

Summary graphs are below.  The full reports by basin:  Gas Rig Counts    Oil Rig Counts


Thursday, January 9, 2014

EIA Natural Gas Inventory Report

EIA reported a 157 BCF inventory withdrawal today:  Weekly Natural Gas Inventory Report

The front months sold off about 20 cents, gradually through the day, bringing the 2014 strip below $4.00 again, despite several periods of severe cold this year, and a cold degree day total to date.

With storage now at the very bottom of the 5 year range, and a record draw anticipated on the next report, a further sell-off seems unwarranted.  Storage should end January at 2,000 BCF (+/- 150), and on average another 500-600 BCF would be burned in February, bringing storage to a lean but manageable 1,100 to 1,400 BCF by April 1, well below last year.  Here are the comps that inventory will face in the remainder of the season:


Canadian Natural Gas Storage Falling Quickly

The strong winter weather and a gas shortage in the US West has gas prices at the Canadian border surging and cross border flows increasing.  Note how quickly Western Canada storage is declining this winter.  As of yesterday the winter withdrawals from storage have exceeded last year by about 90 BCF:


Tuesday, January 7, 2014

EIA Natural Gas Monthly - October 2013

The EIA is still catching up from the government shutdown, and released the October 2013 NG Monthly a week late today.  Dry production was up 0.42 BCFD over 2012.


The NG trade balance improved, consistent with the long term trend and the expectations going forward.  Net imports were down, which was a combination of much lower net imports from Canada, and lower exports to Mexico.  Overall, net imports were down 0.75 BCFD from October 2012.