Pages

Thursday, August 29, 2013

Legacy Shale

US natural gas production is conveniently divided into Shale Gas and Conventional Gas.  Usually the point is to show the inexorable growth of shale, and twilight of conventional production.  The significant exception to that is the Haynesville Shale.  It was rapidly developed in a $4+ gas environment, 2009-2011.  When gas prices fell, oil prices rose, and better shales were discovered, the rigs left and production quickly began to decline.

The rig counts fell from over 150 to 32, now at 42:


The play is split between Louisiana and Texas.  Louisiana has the larger piece, and better public data.  So looking at production in the major haynesville producing parishes (counties) over the last few years we see this:


It must be noted that the above includes perhaps 1 BCFD of legacy production, so the net production from the shale itself in May was probably only around 4 BCFD, a decline of 2.2 BCFD in 18 months.

The play was so young that most wells were in the steepest segment of the decline curve.  The Barnett Shale experienced a similar decline in rigs, but production didn't decline there (meaningfully) because the average well age was much much older.  

I find several aspects of the Haynesville situation important:

  • The production declines must be nearly over.  Not only are wells aging, and production much lower, but the current rig count and average drill time suggests that it will only take about 25 rigs to maintain production around 4 BCFD from the shale.  
  • The steep production decline has masked growth in other shales thusfar, but will not going forward.
  • This is the cleanest example of drilling behavior in dry gas plays, with so many conflicting opinions about what 'break even' gas prices are in various basins.  I think it shows that there are some economic opportunities in the 'core of the core' even below $4 gas.  Now that gas seems to be hitting the skids again, rigs are unlikely to be added.
  • The HVS is probably best positioned for the coming LNG boom, and we might expect to see more JV deals and production lockups for the gulf coast LNG terminals very soon, with Cheniere projecting a late 2015 start date for exports.  We might see more drilling activity sooner, if the forward price curve begins to rise in '15 and beyond.  


Monday, August 26, 2013

Drilling Rig Efficiency

Further to a previous post, here is another look at some rig efficiency stats, calculated from the Baker Hughes rig and spud data, recently released.  When compared to the reported drill times of the most prominent operators in each basin, and the known EUR data points, it is reasonable to suppose that basin-wide productivity and yields will continue to improve significantly, with the possible exception of the older shale basins like the Barnett and Fayetteville.


Friday, August 23, 2013

Natural Gas Rig Counts

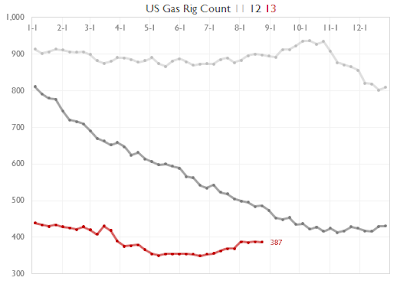
Natural gas rig counts released by Baker Hughes today showed US Gas Rigs down just 1 to 387, and Canadian Gas Rigs up 10 to 137.


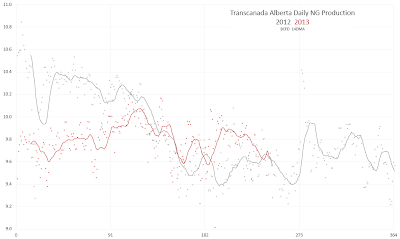
Canadian rig counts are rising quickly and well above last year.  That should begin to show up in Western Canadian production soon.  We are not seeing that at this time.  Field receipts on the TC Nova system in Alberta, which makes up over 80% of production, show this:


Gas prices are very low in WC now, just above $2, due to the transport tariff issue, so maybe we are seeing some curtailments in the production data.  Inventories are swelling as well, so a day of reckoning may lie ahead this season.


Natural Gas Storage Projection

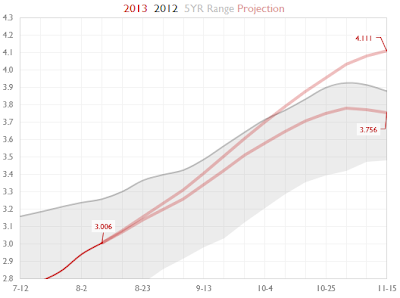
Yesterday's 57 BCF injection reported by the EIA was well below consensus.  Upcoming weather is also warmer than normal.  This lowers the season end storage range, and the midpoint is now 3.904 TCF on Nov 15th:


Reasonable weather variations, price-driven changes, and other changes in supply and demand result in a range of 3.73 to 4.07 as a confidence interval.  That's about a 350 BCF range.

Injections for the next three weeks will remain low due to warm weather.  September should bring weekly injections up into the 80 - 100 BCF range.

As the Atlantic remains quiet nearly 50% into hurricane season, the significant fundamental influences on gas  are going to be any heat waves in the distant forecast, and the critical influence of price on natural gas use in the electric power sector during the shoulder months of Sep-Oct-Nov.

Thursday, August 22, 2013

Renewable Energy Growth

Today the EIA released Electric Power Monthly for June 2013.  As expected, total generation was down from June 2012 and 2011, primarily on weather.  

June wind power was up about 15% Year on Year, and solar continued its predictable growth, up 56% over June 2012.  It still contributes only a quarter of 1% of total generation, so its easy to ignore.  But quite a bit of additional solar will be coming online in the next two years, along with the small but growing 'problem' of off-grid capacity.  Installed PV (photo-voltaic)  capacity has been doubling annually for a while.  That can't continue, but significant growth will.  


Solar and wind make up all the growth in US renewables, and small as they may seem, they are taking important market share away from fossil fuels.  Here is the 12 month trailing average of renewables (ex-hydro) market share.  It is a threat to traditional utilities and pricing models in the industry, as substantial capacity is scheduled to be added in the next two years.


Wednesday, August 21, 2013

Natural Gas Production Estimates from the EIA

Each month the U.S. Energy Information Administration reports historical monthly natural gas production data as part of the Natural Gas Monthly Report.  They also issue forecasts in the monthly Short Term Energy Outlook.Like most private analysts, they underestimated the growth in shale gas production. 

Because so much capital is being committed to natural gas drilling in north america and prices are so depressed, accurate forecasting of future production is critical.  Several pieces of the old formula appear to be broken, as rig counts have fallen, prices have fallen, and still production grows month after month.  Many one-time factors have been blamed for the disconnect:
  • Materials were in short supply so completions were delayed.  From pipe and casing to frac sand, the industry was often short.
  • Completion crews and pressure pumping capacity.  This definitely delayed completions and created a large inventory of non-producing wells.  This varied by basin.
  • Gas treating capacity.  The construction of cryogenic processors to strip liquids is lagging production in new basins.
  • Pipeline takeaway capacity.  Well known, self explanatory.
As gas storage surpluses were worked off in the spring of 2013, many were eager to bet the turn, and producers were certainly ready to receive their beautiful reward after suffering the pain for so long.  Analysts and CEOs were comfortable declaring that the fix is in, and low prices cured low prices etc...  Consensus forecasts for Henry Hub were into the $4's for the latter half of 2013 and beyond.

At $3.45 today and facing the possibility of record storage breaching 4 TCF in Nov, consensus is falling and the 2014 Strip is at $3.89.  More forecasts are acknowledging further production growth in 2014.

What is the EIA saying?  Two graphics.  The first is historical marketed production, and EIA's most current projection through Dec 2014.  It calls for further increases, with some monthly noise for hurricanes and maintenance.  The second graph shows the evolution of the EIA forecast for Dec '13 production.  They first issued estimates in January 2012, so we have the original estimate and 19 monthly revisions.  The trend will be evident.

What is the point?  The point is that acceptance of the shale gas revolution has been so reluctant, and underestimated time and again.  And the point of that point is to ask, "Are we still doing so?".  Drillers continue to find more gas, faster, cheaper, and more quickly to market.  The slope of the learning curve doesn't seem to be flattening out quite yet.  And something smells fishy about the broad consensus that production has plateaued.  That is a distinct possibility, but perhaps not so certain.


Be careful on this next graph.  Every data point is the same month, December 2013.  Only the production forecast has changed, and by a lot, over 20 months:


Tuesday, August 20, 2013

2013 Natural Gas Storage Peak Projection

With about 90 days remaining in injection season, the peak natural gas inventory level is still uncertain.  Weather and prices both will play an important part.  Price, because that determines whether utilities will burn coal or gas at a given power load, and weather because both heating and cooling demand will soon come into play, along with the season risks in the tropics.  In the current era, so much of the offshore infrastructure is storm-resistant that shut-ins are usually brief, and cyclones can suppress air conditioning demand after landfall.

The most recent storage report shows US inventories at 3.006 TCF on August 9th.  Peak storage is usually reached between October 25th and November 22nd.  With increasing uncertainty in distant weeks, here is the current range forecast storage range based on a variety of factors.  Clearly still a wide window.

Sunday, August 18, 2013

Natural Gas: Rig Counts and Production

Rig counts were once closely watched for their strong correlation to natural gas and oil production levels.  That disconnected with the shale and hydrofracturing revolutions in the past five years, and more recently the advent of liquids-rich natural gas.  Nevertheless, drilling remains the only known method of producing oil and gas, so working rigs are still the key.  Helpfully, Baker Hughes has recently added well count data to their weekly rig count data release.  That enables rig productivity calculations to be attempted.

Most basically, we have two of the three variables needed to estimate developed reserves, and from that, production:

  • Working Rig Count
  • Rig Productivity (wells per rig)
  • Reserves per Well
What did the Baker Hughes data show, and not show?  
It shed no light on one large problem, that of well classification.  The data is provided by basin, but without and oil/gas breakout.  We are a few years into a collapsing gas rig count and a spiking oil rig count, so basins that have an oil, dry gas, and wet gas window cannot be easily analyzed from this data.
It does show average rig counts, and total well spuds, by basin.  The data is by calendar quarter, and begins in Q1 2012, so there are 6 quarters of complete data.


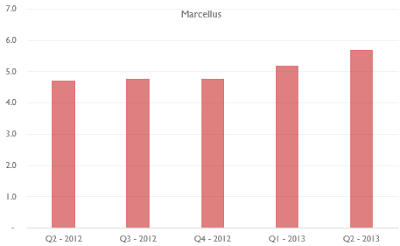
Even where the rig productivity data isn't clean or doesn't pass the common sense test, the well spud count itself is useful.  Here are the well spuds for the most recent quarter, Q2 2013:


Rig productivity is clearly improving, but the data show rates of efficiency and implied drill times that are much lower than the best-in-class operators are reporting publicly.  Here are the well spuds per rig in a few well known basins:


The lesson from history is that the best operators continue to improve, and the worst operators improve more (if they live), so it appears there is substantial room for improvement in these plays.  The younger plays also improve more, due to the steeper slope of the learning curve, and the decreasing need to devote rigs to R&D science projects.

In particular consider the Haynesville.  The most recent quarter indicates 3 well spuds per rig, thus an implied 30 day spud-to-spud time.  Q2 2012 spuds were 1.8, and implied 50 days per well.  The rigs left this play quickly in 2011, and then stabilized, currently at 42.  Per Baker Hughes Rig Count......


If we guess that the wells being drilled have a 6 BCF ultimate recovery potential, we could say that:

42 rigs  x  30 days per well  x 6BCF per well  = 250 BCF per month of developed resource.  Over time, the developed resource would approximate the production level, and 250 BCF per month is 8.3 BCF per day.  Of course there are nuances and important other factors that make this a theoretical maximum only, but it demonstrates that a few dozen rigs can accomplish a lot in an environment where all 3 variables are constantly improving.  


Sunday, August 11, 2013

US Electricity Generation: A Zero Sum Game

The electricity industry has an uncertain future that belies the historically stable, low beta performance of utilities.  The past was stable in part because growth was strong and reliable....from 334 BKwH  in 1950 to 4,157 BKwH in 2007, with only 2 years of negative growth.


Beginning with the financial crisis in '08, things changed.  As in many sectors, growth turned negative.  Unlike many sectors, it has not recovered.


And through July of 2013 there doesn't appear to be any change in the red slope for this year.  This has important implications for the industry, and for the feed stock components of power generation where smaller revolutions are taking place already.

So five significant variables for the industry:

  • Uncertain growth in aggregate power demand
  • Regulatory opposition to fossil fuels (chiefly coal)
  • Subsidy and protection for renewables
  • Shale gas revolution 
  • Everything else (technology risks, ageing grid, conservation, macro, nuclear, ham sandwiches)
Virtually all of these issues are urgent, and generating immediate impacts on the energy industry.  And when the pie is not growing, as is the case for now, any growth in market share for one component is theft from another.  Up to now, the threat posed by renewables to fossil fuels was negligible because power demand was growing and renewable market share was meaninglessly small.  And the regulatory/environmental opposition to coal fired power was strong but primarily preventing expansions.  

Now, coal is being crushed by the combination of cheap shale gas, relentless regulation, a decline in exports, and the presence, at last, of renewables on the radar.  Coal's worst nightmare is wind.  And wind is where the growth is in renewables.  

Fossil fuels are losing market share:


And coal is quickly ceding its share of the fossil fuel component:


In 2014, a significant number of coal fired generating stations will be retired, and the price of natural gas is low enough to encourage coal to gas switching in some areas of the country.  This phenomenon is very price sensitive, and very self-correcting, so it cannot be reliably predicted very far into the future when prices are near the boundary.