Pages

Tuesday, January 31, 2017

Nuclear Power Output Steady at +1 BCFE vs 2016

This week marks the first period since early December that US nuclear power generators maintained a capacity factor substantially above 2016.  Yesterday's factor, 95.6%, was 5% above last year, and the natural gas displacement of this high output is exceeding last year by almost 1 BCFD right now.  

The difference should diminish over the next 3 days, as last year's capacity factor rose sharply during the same period:


2016-17 Winter Isn't Shaping Up to be Cold. Looks About Like 2015-16

A cold mid-December and then a short intense blast in early January have been the only above average cold periods so far this season, and we are only about 50 HDD's ahead of 2015-16 right now, with the prospect of losing that lead over the next 15 days.

Cold forecasts just haven't come to fruition, and time is running out:


Monday, January 30, 2017

Pemex Reports December Oil and Gas Production Falls to New Lows

Pemex seems almost to have exited the drilling and exploration business altogether, as December output fell sharply to continue the multiyear trend toward output collapse.

Crude oil output fell 37M BOPD to 2.035 MMBOPD, or a 240 thousand barrel per day decline over last December.

Natural gas output fell 135 MMCF per day, or 2.4% to 5.38 BCFD, or a 0.83 BCFD decline over last December.

The charts and graphs tell the story better:


Northwest Hydropower Loses Output, No Longer Exceeding 2016

The Bonneville Power Administration reports declining hydro output over the last 11 days, falling to more than 2 GW below last year.  This is resulting in higher thermal generation and lower exports to California.  This difference is about equal to the excess hydro generation we have been seeing recently in California, so the net effect is about zero right now vs last year's hydro output.  This represents a significant change from early January, when both CAISO and BPA were reporting strong hydro power:

BPA Hydro output:

BPA thermal generation:


Sunday, January 29, 2017

Southern Power Pool Wind Generation Jumps 50% Between Jan 2016 and Jan 2017

Wind capacity additions mostly came in the SPP region last year, and it shows.  Monthly generation has been consistently beating prior year, and this January is an extreme example.

Average output for the month to date has been around 6.2 GW, while it was closer to 4.1 GW last year. Here are the daily averages, with January '16 in grey, and January '17 (to date) in red.  If all this new power generation offset natural gas fired turbines, it would equate to roughly 0.5 BCFD.  That's a lot.  


Saturday, January 28, 2017

Gas to Coal Switching Latency

Natural gas has been cheaper in January than it was in December.  But for multiple reasons utilities do not switch from gas to coal instantly.  In a region like MISO, it is proving evident that suddenly high December natural gas prices did not push gas down the dispatch curve as much as it was economically justified to do. 
The evidence is this:  gas continued to lose significant market share to coal in January, despite lower gas prices thus far in the month.  How bad is it?  Take a look.  At nearly every level of thermal power output in MISO, gas was down an additional 5% of the thermal power market.  

There are small signs that this trend has at least stopped, and maybe begun to reverse slightly, but not much.  December already represents a big loss for natural gas vs. prior periods.


Friday, January 27, 2017

Alberta Natural Gas Production Recovers, But Storage Falls Faster Than Last Winter

By this date in January last year, 21 BCF had been withdrawn from storage on the TC Nova system.  This year, 31.5 BCF has been removed.  In part that can be explained by weather, but it's also partially due to production shortfalls early this month.  


Daily production dipped to about 10.6 BCFD on the 11th, and has been recovering since.  In the recent week, receipts were comparable to last year, and brought the month's average up above 11 BCFD, which is 200 MMCFD below last year's average for January.  That gap should close further in the last few days of January, but production must increase further to keep pace with last year's 11.4 BCFD average for February:

Heating Degree Day Comparisons

Gas prices have been struggling this month, with warm weather the chief culprit.  How is the current winter stacking up?  Well, the HDD count from Oct 1 through Jan 31 (next 4 day forecast assumed correct) puts this winter ahead of last winter by a 52 HDD margin.  

But we are behind the 20 year mean by a solid 299 HDD, which represents a tremendous amount of heating and electric load for natural gas.  I'm using the CPC numbers for gas-utility weighted HDDs in the calculation.  This suggests that gas could be very, very expensive had the weather been close to the mean, perhaps aiming toward a sub 1 TCF storage carryout in March/April.  That's a number that would light a fire, so to speak, under the Henry Hub forward strip.  

Here is the same data as a cumulation:

Rigs Counts Surge Higher: Oil +15 Gas +3

The US oil rig count rose 15 to keep the drilling revival on trend, confirming that the current oil price environment in the $50's is enough to generate strong returns, especially in the Permian, SCOOP, and Eagle Ford.

The gas rig count rose more modestly, with the Haynesville adding 2 of the 3 rigs.


The Canadian oil rig count rose by 7, to a strong 200 rigs.  And the gas rig count dropped by 4 but remains close to a 2 year high:


Gas to Coal to Gas Switching in Power Generation

The big marketshare losses to coal this winter cast an ominous pall over the upcoming shoulder season demand for natural gas.  A look at the MISO region this month tells a bit of the story, as we entered the month with high gas prices, which have begun to abate in the last few weeks.

The grey line shows natural gas marketshare of thermal generation at various aggregate thermal demand levels in January 2016.  It indicates that gas was able to maintain a 30%+ marketshare even at low burn levels.  

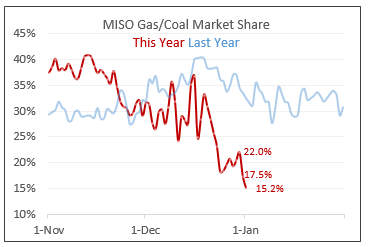
This January (red line), lower thermal demand levels led to a steep drop in marketshare, going as low as 15%.

Isolating the most recent week (Jan 20-26) of this month shows marketshare slightly higher than the month as a whole, by perhaps 1-2%.  That's probably statistically insignificant, but it points in the right direction, providing some hope that price sensitive generators are finding it more appealing to run gas turbines.  Hopefully gas doesn't need to break below $3 to trigger further gains before shoulder season begins.


Here's another way of seeing the split between coal and gas in MISO, showing how much share gas lost since November:

Thursday, January 26, 2017

Moderate Weather Outlook, Below Average Cold for JAN

Including the short term forecast from CPC, the total gas-utility-weighted HDDs for January look to come in about 10% below the 20 year average.


And the longer range 15 day forecast based on the GFS shows nothing far from normal:

Wednesday, January 25, 2017

Nuclear Power Capacity Factor Rises Above 2016

Nuclear power output is now about 3% higher than last year, equating to about 0.5 BCF less natural gas consumed for power burn:


Tuesday, January 24, 2017

Monday, January 23, 2017

Nuclear Power Output Fell At This Time Last Year

nuclear power output has been similar to 2016 for the last month.  But after today, the comparisons to 2016 change significantly.  Nuclear output started falling quickly in '16, then recovered briefly after a week, and continued their downward slide into spring maintenance and refueling season.  That may not happen to such an extent this year:


Gas Use in Midwest Electric Generation Falls Drastically Vs Coal

MISO shows yesterday's gas market share of thermal generation falling to 18.9% vs coal's 91.1%.  Total generation was very low, but even so, this represents very significant demand destruction for NG this winter, in the current higher gas price environment:


Sunday, January 22, 2017

California Hydro Power Breaking Records, near 100GWh Per Day, Almost 3X Last Year

The heavy rains are driving record output for hydro power in CAISO region, and building snowpacks for spring runoff potential.

The last two days have averaged about 4GW, while last year was near 1.4GW:


Friday, January 20, 2017

Steep Rise in Rig Counts: Oil +29 Gas +6

After a lull over the holidays, rigs were added in bulk this week.  Oil rigs were up 29, returning the rig count to the trend line that began last May.  Most of the rigs were added in the Permian (+13), with the Williston also showing signs of life at +3.  Cana Woodford also added 9, pushing the count to 46 in that basin.  


The Canadian rig count continues to astound, with 23 more oil rigs added, and 5 gas rigs.  Both those fleets are now back to where they were in early 2015.

Thursday, January 19, 2017

EIA Natural Gas Inventories Fall 243 BCF

A larger than expected draw of 243 BCF from working gas inventories was reported today for the week ended Jan 13.  This puts inventories in the middle of the historical range, and about 77 BCF below the 5 year average.  The report wasn't initially bullish, but combined with improving weather forecasts, gas rose about 7-9 cents at midday.  


Wednesday, January 18, 2017

Gas Losing Markeshare To Coal, Quantified

Here's another way of looking at the coal switching scenario in MISO.  It compares the Gas/Coal split at various thermal generation demand levels in December 2016 and December 2015.

To wit, on a day when total demand for thermal generation was about 12 BCFE, gas would garner about 36% of that generation last December, and about 28% this year.  If you like, that's about 4.3 BCF last year, and about 3.3 BCF this year, a clean 1 BCFD loss of marketshare on an average(ish) day.  


Here's a glance at daily generation, this year and last, over NOV-JAN period in MISO.


And the point is?

Any talk of gas in the $4 range is also talk of massive demand destruction from power burn.

Alberta Production Recovers Slowly, Storage Withdrawals Moderate

The year began with a bang, as cold weather, lower production, higher exports, and easy year-on-year comparisons saw the TC Nova surplus storage situation improving rapidly.  Now the warm north american weather has mitigated all those factors, and production is recovering above 11 BCFD, while storage draws have declined to near zero (-114 MMCF yesterday):


Tuesday, January 17, 2017

Nuclear Power Output is Identical Year-on-Year

Today's nuclear capacity factor is 95.8%, the same as this date last year.  It has been comparable for the last ten days.  Last year, the capacity factor started falling on Jan 24, with some short term outages that led into the spring refueling and maintenance season in February.  Unless some unplanned maintenance is required, the last week in January of this year could outperform last year, offsetting some gas demand.


The gas equivalent of the difference between this year and last year has been very slight for the last ten days:


Friday, January 13, 2017

Rig Counts: Oil Rigs Down 7, Gas Gains 1. Sharp Rise in Canadian Oil & Gas Drilling Activity

Holiday effects might be dampening the upward trend in US oil drilling, which was down 7 this week.  As for major basins, Barnett lost an oil rig, Eagle Ford gained 1, Granite Wash lost 1, Permian gained 1, Williston lost 1.

Gas rigs were up 1.  Nonmajor plays added 5, so the net effect was a decline in drilling potential.  Utica and Marcellus each lost 1 rig.  Haynesville and Eagle Ford both lost a single gas rig as well. 


Canadian rig counts surged on post holiday seasonality, pushing both counts to the highest in almost two years:


Thursday, January 12, 2017

Henry Hub Comparisons

Just a quick reminder that Henry Hub Spot Price went below $2 in mid-Feb, and didn't recover above $2 until June.  That's going to make the coal vs gas competition a very different equation this year:


EIA Natural Gas Inventory: Large Draw Lifts Prices

Working natural gas in underground storage fell by 151 BCF last week, about 6-7 BCF more than consensus expectations.  Prices were already up substantially prior to the release, on colder forecasts for late January.  And prices were up another 5-10 cents after the EIA information was published.


The forecast remains much much warmer than normal for the next two weeks, with low heating and electrical requirements.  But a confidence interval is still probably centered on 1.7 TCF as the winter storage carryout in March, and that's currently supportive of the strip pricing, with production flat and the export/import balance steadily shifting toward net exports.  

A third LNG train is expected to begin taking gas around April, and pipeline exports to Mexico are steadily creeping upward with each new pipeline expansion.  So unless extreme warmth persists, and/or production suddenly begins another step up, the tightness should keep the gas strip comfortably above the $3 mark.  

Wednesday, January 11, 2017

Gas to Coal Switching: Reducing Gas Demand By More Than Expected

With each day that gas prices remained elevated compared to last year, the short term effects of hedging, contract commitments, and other temporary factors wear off, and we begin to see the fundamental economics for power generation.  Yesterday ERCOT reported it's fuel mix for December, and natural gas lost more than 1.3 BCFE per day to coal.  
In MISO, the numbers reveal themselves daily, and the impact is also more than 1 BCFE per day.  This suggests that the total impact of switching must be in the 5+ BCFE per day range nationwide.

Here's a look at the daily effects in MISO.  First of all, we see that the daily thermal power demand in December was comparable, year on year.  To wit, it was about 364 BCFE in Dec 2015, and 370 BCFE in 2016.  Close enough for government work:
 

That thermal generation demand was split between Natural Gas and Coal as follows:

Weather Forecast for Record Warmth Depresses Energy Demand

The two week outlook is for much below normal heating demand, as record high temps across the CONUS suggest that January will deliver very little power or home heating draws on natural gas.

The Climate Prediction Center shows a forecast through 11/17 that ends with record low gas-utility weighted HDDs:


And the Deltix forecast based on the GFS extends the warmth through the balance of the 15 day outlook:

Tuesday, January 10, 2017

Pacific Northwest Hydro Power is Strong, But on Par With Last Year

The heavy stream flow on the Columbia is driving continued high power generation in the Bonneville Power Admin region, but last year was also a high output month, so the comps are similar.  Both are much above 2015:


Power load in the region has been well above normal due to a sharp cold front, but it should taper through the rest of January, enabling BPA to send more power south:


ERCOT Fuel Mix Favors Coal in December, Gas Loses Out

For the first time this year, coal generation outpaced gas in the ERCOT region in December.  Natural Gas lost significant market share as coal-fired output grew 34% while gas-fired power fell by 8.5%.


In terms of overall ERCOT market share, gas fell from 37% to 30% while coal gained 6% as it rose from 32.3% to 38.3%:


Monday, January 9, 2017

Texas Drilling and Completion Activity in December: Oil Gains, Gas Loses

The Texas Railroad Commission reported December drilling, completion, and permitting activity today.  It showed a sharp increase in well permits, and a rise in reported new oil well completions.  Gas completions, however, hit a new low at just 75 new wells:


Oil completions rose from 264 to 384, along with oil rig counts and prices:

Alberta Natural Gas Production and Storage Remain Tight Year-on-Year

Whether due to cold weather or other variables, the step-down in TC Nova natural gas output in the new year continues.  After hitting a one day peak above 11.5 BCF, output has been averaging about 10.9 in January.


Higher demand, and exports to the US, are pulling more from storage, and the 50 BCF surplus that began the year is shrinking steadily.  Daily withdrawals have been more than double prior year amounts, resulting in a 7 BCF reduction in the surplus through nine days of January:


Weather Outlook Brings Down Natural Gas

The cold weather was intense but it ends today for the foreseeable future.  The 15 day outlook shows a profound reversal to warmth, with only about 60% of normal HDDs forecast.

The CPC, including the 7 day forecast, shows some of the warmth, and brings us to about normal HDD's through mid month.  It's the outlook beyond that point that will take January down.


Last year, January was about average, here's a day by day look at last winter vs this winter so far.  Most of the warmth last year was concentrated in OCT-NOV-DEC:

Friday, January 6, 2017

Rig Counts: Oil +4 Gas +3

Rig counts rose modestly this week, according to Baker Hughes.  Both oil and gas rigs continued the trend lines established last summer.  Oil rigs rose by 4 to 529, with gains in the Permian (+3) and Eagle Ford (+1).  

Gas rigs rose by a net 3, with major basins gaining:  Haynesville (+2), Utica (+1) and Marcellus (+1).


In Canada, the post holiday drilling recovery began in earnest, with oil rigs up 29 this week after falling by 54 in the prior week.  Gas activity was stronger, with a bounce to a new year high.  Gas rigs were up +23 to 123 after falling by 13 last week:


Nuclear Power Output Comparable to Last Year

Now that maintenance and refueling season is at an end, power output is near capacity, as it was last year at this time.  Today the capacity factor is projected at 96.4%, a new high for the season, and last year it stood at 96.8%.


In terms of natural gas volumes, the difference between today and this day last year is just 0.07 BCFE.  Last year, the capacity factor began declining about this time, so we may be facing a relative surplus if there are no unplanned maintenance events.

Thursday, January 5, 2017

Weather Forecast: Four Days of Cold, Then Tropical

The CPC 7 day forecast shows the sharp and short cold blast:


And the GFS 15 day forecast depicts the pervasive warmth to follow:

Western US Hydro Power Generation: CA & WA Maintaining High Output in January

Hydro output remains strong in the Pacific Northwest, but it isn't exceeding last year by much in January.  Last year was also a high output year:


In California, where capacity is much lower, hydro output is about 1 GW above last year so far in January.  Thusfar it is averaging 2.54 GW, against last year's 1.42 GW for the full month of January:

EIA Natural Gas Inventory Falls 49 BCF, Much Less Than Expected

Analysts were looking for a draw around 80+ BCF for the holiday week ended Dec 30, and the market sold off after a 49 BCF draw was reported.  It left inventories at 3.311 TCF, implying that working inventories will end the year at about 3.3 TCF.


This small withdrawal managed to maintain inventories slightly below the 5 year average, for only the second week this year:

Alberta Natural Gas Production and Storage Continues Tighter Than 2016

Four days into the new year, production on the TC Nova system in western Canada is lagging 2016.  It has averaged 11 BCFD in the first four days of the year, about 200 MMCF lower than 2016.  Production typically picks up steam through the winter, as the holiday effect on drilling and completion wears off, and frozen earth facilitates production activity.  

Here are the daily receipts on TC Nova:


And here is a view of the entire 2016 daily activity and monthly averages, showing seasonality, daily variability, and the beginnings of 2017:

Wednesday, January 4, 2017

Weather Forecast Shifts to Deep Warming Trend

The 1/4/17 18Z GFS-based forecast shifted to a heat wave this afternoon, and unless it reverses course, the outlook for natural gas demand will be abysmal, with barely any gas withdrawn from storage over the latter 10 days of the 15 day forecast.  Here's the comparison with normal:


Weather Forecast: Short Cold Blast Followed by Unseasonable Warmth

A surge of cold over the next 5 days will give way to a sharp warming trend, dropping the January average HDD count to below normal, and natural gas prices are reflecting that in spades.  

Here are the CPC gas-utility weighted totals, with their 7 day forecast through Jan 10th.


The longer range outlook shows the extreme return to tropical conditions in the CONUS, with HDD counts a bit above half their norms:

MISO Region Fuel Mix Continues to Favor Coal

As power load levels normalize after the holidays, natural gas for power burn demand has not bounced back in the MISO operational area.  Last January, the gas/coal marketshare was about 33/67, and this year the first three days of January have averaged 17/83.  That's roughly half the gas demand.


Translated into BCF equivalent (roughly speaking), Jan 1-3 last year averaged 3.4 BCFD, and Jan 1-3 this year came in at exactly half, or 1.7 BCFD:

Tuesday, January 3, 2017

Nuclear Power Output Steady, Slightly Below Last Winter

Nuclear power output in the continental US has been level over the past 9 days, about 1% below last year.  This is a change from the first part of winter, where output was outpacing '15.  However, this was the high water mark for nuclear power generation last year, and reactors began to go offline on Jan 8th, so we may again experience a surplus of electricity from nukes.


On a gas equivalent basis, it adds up to about 2 BCF less fossil fuel generation per week at the current level:

Alberta Natural Gas Production and Storage Tighten in 2017

Cooler weather and the end of the holidays has seen the Alberta TC Nova system reporting reduced production volumes and larger withdrawals from storage compared to last year in the early days of 2017.

High daily receipts, near 11.5 BCFD, were seen in the last week of 2016, but the first two days of January averaged 11.1 BCFD, down 0.4 BCFD.  Jan-Feb-Mar are seasonally high months, and the rising rig count should translate into some biennial daily high receipts in the coming weeks.


On the storage front, the withdrawals in the first two days of the year averaged over 1.2 BCF, more than double last year.  Two days does not a trend make, and weather is colder than normal, but the nightmare of last year's excess storage volumes looks unlikely to be repeated (Net withdrawals in Jan-Mar of last year were zero!):


Monday, January 2, 2017

EIA Reports OCT Natural Gas Production

On Friday The Energy Information Administration issued its Natural Gas Monthly Report for October.  Dry production was down 1.18 BCFD from the previous month, to 70.69 BCFD.  That is 3.43 BCFD below the same month in 2015.  


Dry production has been falling faster than gross production, because more liquids are being stripped out.  The percentage of gross production that is being removed as NGLs has been rising, and is up from about 5.3% a year ago to about 5.9% now:


Extent of Natural Gas Market Share Losses to Coal in Electricity Generation

Here is the ongoing story of the (presumably price driven) loss of market share by natural gas in the power generation market, by the example of the MISO power region.  MISO represents 15-20% of the total national generation and load.

Coincident with the sharp rise in natural gas prices, gas began losing share to coal in mid-November of this year.  Low overall load will accentuate this trend to an extent, but the trend is visible through periods of both low and high load.  The lowest gas share of all came yesterday (Jan 1), with gas taking just 15.2% of the carbon fuel power market, to coal's 84.8%.  This compares to last year where the January gas share was near 35%.


In terms of absolute fuel volumes, we see the huge change.  Gas is now almost 2 BCFD behind last year, while coal is holding it's own:

Weather Forecast: Cold Blast But Overall Average

December finished with average cold (872 HDD's vs 859 Average), and the outlook for the first half of January is for average weather as well, despite a 6 day period of intense cold beginning on Jan 4.

The NOAA Climate Prediction Center shows the cold in its 7 day forecast, after a mild 3 day period, which would take Gas Weighted HDD's to 252 through January 8th, against a 240 HDD historical average.


The Energy Metro Desk forecast based on the GFS shows a 15 day outlook with a 6 day cold period starting January 4th, then mostly below average heating demand in the latter portion (more volatile) of the forecast.  These last 5 days have been flipping hot/cold/hot in the last few model runs: