Pages

Wednesday, April 30, 2014

EIA Natural Gas Gross Production Report

The EIA released its Gross Production Report for FEB 2014 today, and it showed strong seasonality effects of winter curtailments with most onshore regions declining month-on-month.  The Gulf of Mexico was higher, as was Wyoming (slightly) and the 'Other States' category which is largely the Marcellus/Utica of Ohio, PA, and West Virginia.  All remaining states, including Texas and Louisiana, were down on the month.

Nevertheless, Gross withdrawals continued to show long term strength, outproducing last February by 2.59 BCFD.  It reached 75.38 BCFD in FEB, but fell short of the record output last November of 75.98 BCFD.

Natural Gas Gross Production Report


EIA Weekly Petroleum Status: Rising Inventories, Rebounding Demand

Inventory
EIA reports 4/25/14 inventories rose a total of 7.91 MMBBL, with Crude, Gasoline, and Diesel all increasing by 1.5 to 2 MMBBL each.  Only jet fuel and resid fuel declined this week.  

This kept commercial crude inventories above the historical range for the third week in a row.  Gasoline inventories moved back toward the middle of the range, and diesel held just below the range, about 20 million barrels below the midpoint.  

Cushing inventories fell further below the range, and gulf coast inventories experienced another huge increase, now well above the range.
EIA Weekly Petroleum Inventory

Core inventories this week:


Cushing and Gulf Coast inventories:


Demand
Most demand categories recovered this week, with gasoline up 263K BOEPD to the middle of the range, and diesel remaining at the high end..
EIA Weekly Petroleum Demand


Supply
Supply was little changed this week, with the trade balance turning slightly more negative as both crude imports and product exports were lower from the previous week.
EIA Weekly Petroleum Supply


Tuesday, April 29, 2014

Western Canada Nat Gas Inventories Not Recovering Quickly

After a winter of high demand, high exports, and production curtailments, the low gas inventories in the Canadian west are not rebuilding at a sufficient pace.  Gas production is outpacing 2013 by roughly 0.25BCFD lately, but high gas prices in the western U.S. are drawing gas across the border.  Since April 1, storage injections in Alberta are pacing 2013.


Monday, April 28, 2014

Cooling Requirements Rise Above Normal in Current Week

This week marks the first significant CDD reading, at 16 CDD nationally vs 12 Normal.  This includes warm anomalies in the large gas consuming states, except Texas.  Last year the similar week saw a +2 anomaly, at 14 CDD:


Texas will see a decline in cooling requirements this week, while Florida shifts much warmer and California sees it's first wave of heat.  Louisiana will also be above normal for the second week in a row:


Weather: Heating Requirements Near Normal for 2 Weeks

In the week ended Saturday, NOAA's Climate Prediction Center recorded a near normal HDD count of 68 vs normal 75.  This is much colder than they forecast a week ago.  The current week has a similar expectation of 58 HDD, which is 5 below normal.


Sunday, April 27, 2014

Pemex Reports Declining Oil Production, Rising Gas in March

Pemex released its oil and gas statistics for March 2014 on Friday, reporting oil production at new lows.  Total liquids were down 19KBOPD to a new long term low, of 2.847MMBOEPD, and crude was down a steeper 32KBPOD, as NGL production rose.  

PEMEX Mexico Oil Production


Natural gas production rose slightly, primary on the back of a long term trend in associated gas production:

PEMEX Mexico Natural Gas Production


Friday, April 25, 2014

Rig Counts: Big Gains for Oil (+24) and Gas (+7)

Baker Hughes rig counts for April 25th show another large build in oil rigs (+24) and a rebound in gas rigs as well (+7).


Oil rigs are on a relentless growth trajectory, having made new highs each week for the last two months.  Horizontals broke 1,000 this week, as directionals and vertical rigs have been flat this year so far.  Gas rigs are off the lows but only just, at 238 horizontals.


The basin analysis shows that the boom in the Permian is unabated, but things did pause a bit this week with a net gain of 2 rigs, but rig power declined with horizontals off by 3:


The largest gas rig gains came in the Marcellus, which gained a significant 7 horizontals this week:


And the Haynesville is also showing signs of life, gaining 2 horizontals this week to reach 46 active rigs, the most since July 2012.


Thursday, April 24, 2014

EIA Natural Gas Inventory: Near Expectations at +49 BCF

Today's EIA Natural Gas Storage Report showed an injection of 49 BCF, within the range of expectation (25-65 BCF), and near the 5 year average of 47 BCF.

Natural Gas Weekly Storage Report


With 6 months remaining in the injection season, storage remains over 1 TCF below the 5 year average, and 831 BCF below last year at this time:


Wednesday, April 23, 2014

EIA Weekly Petroleum Report: Sharp Rise in Crude Inventory, Decline in Demand

Inventory
Crude inventories rose sharply this week, by over 3.5 MMBBL.  All other petroleum products were also higher, except gasoline which fell a slight 274 thousand barrels.  This coincided with a week that saw a decline in demand.  Cushing inventories fell again, but gulf coast volumes swelled to a new high.  Commercial crude inventories are now at their highest in the last six years.


Regional inventories saw Cushing fall, Gulf Coast rise:


Supply
US production swelled to a new high of 8.36 MBBLD, up almost 60,000 barrels a day over last week. 


And the trade balance improved despite falling demand.  Crude imports were down about half a million barrels a day, and product exports rose by 147KBBLD.


Demand
Steep declines in both Gasoline and Diesel demand led to one of the weakest showings of the year overall, though diesel demand remains robust, at the top end of the historical range.


Tuesday, April 22, 2014

EIA Electric Power Monthly: Coal Rebounds in Feb

Today's EIA Electric Power Monthly was released with February operating statistics.  It shows coal taking back significant market share from natural gas, as gas prices spiked throughout the month on cold weather.

It is a reminder of what may happen again if gas prices push north of $5 this year, which they indeed might.
Electric Power Monthly


Solar also showed early indications of what will certainly be a very strong year for this growing power source hungry for market share.  Expect solar generation to double again in 2014.


Growing Impact of Solar Power in the Southwest

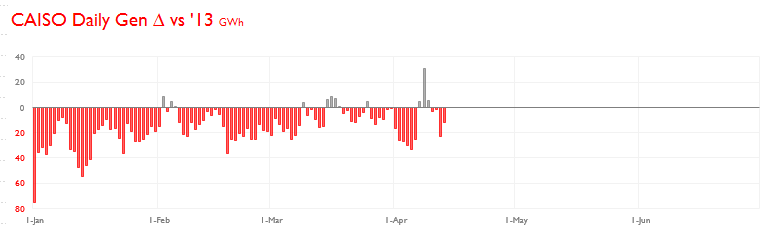
Solar continues its rapid expansion in California, both distributed and utility scale.  The real impact of the incremental additions will be felt this summer, when daily generation peaks in the afternoon instead of after dark.  In April, the peak is normally around 8 pm, so solar power is not shaving the peak.  

Considering the average April daily load profile, here is the impact of utility scale solar additions in the last year.   Again, this is how much more solar generation was added in the last year. 


And here is the total current solar generation, as a component of average daily April load:


California should see a massive impact from solar energy expansion this summer.  With over 100,000 rooftops now generating solar power on the other side of the meter (not reflected in the charts above), the total load should also see a reduction this summer on-peak.  Estimates indicate that something like 800 MW of distributed solar are already operating in California, and growing.  

This should accelerate the collision that appears inevitable between all the stakeholders of electric power, including the independent power providers.  It is conceivable that total solar generation capacity could exceed 7 GW in California by next summer.  

A compounding problem is the lack of power demand.  Total electricity sales is in a noticeable decline in CA this year.  The grid will be stressed, as will the balance sheets.


Nuclear Power Output Approaching Seasonal Low, Tracking 2013

The refueling season for the US nuclear fleet is closely tracking 2013, and near the low point for the spring refueling season.  There were slightly more reactors scheduled for refueling this year, but fewer reactors have been offline for unscheduled reasons, so overall electric power output has been about equal to 2013.
Nuclear Power Report


Monday, April 21, 2014

Western US Hydroelectric Generation Update: Lower Estimates

The hydro picture out west is mixed.

Stream flow forecasts continue to hold above normal in the Northwest, up slightly from last week to 105.5% of normal:

But the Sierra Nevada outlook is dry, with the statewide snow pack estimate down to 18% of normal for this date.


But this has not translated into significant declines in hydro generation in CAISO yet, with daily generation only off by about 15 GWh per day lately, versus last year.  Lower snow pack should show itself by June, as flows fall off earlier than normal.


Meanwhile the BPA generation in the Northwest is running above last year again, lately averaging about 11 GW, or about 1 GW above this time last year.


Finally, the snow pack in the Colorado River Basin has fallen, with melt beginning sooner than normal.  This is raising river levels and filling the larger reservoirs (Lake Powell and Lake Mead) more quickly than normal.


Tuesday, April 15, 2014

Texas Electricity Generation March 2014: Natural Gas Regains Market Share from Coal

In the ERCOT Demand and Energy Report released yesterday, moderating natural gas prices likely helped natural gas regain market share in the ERCOT Texas market in March.  Total generation was up as cold weather and rising baseload demand drove daily demand up more than 6% over 2013.  Wind generation was down YOY, but fossil fuels kept a 72.3% market share in both years.  

More significantly, gas regained significant market share from coal in a month with much lower average demand, a sign that price sensitive generators are returning to gas and will continue to do so with prices around $4.50 per mcf and coal prices sitting well above historical levels.  


Coal lost 2.4% of the fossil fuel market, as gas gained the same amount.  Gas was still 1.1% below March 2013 levels, but on an energy basis total gas-fired power was up, from 8.239 TWh last March to 8.545 TWh this March.


Nuclear Power Output Falls to Season Low, Tracking 2013

US nuclear power output has fallen 3 days running, and is less than 2 weeks from its expected trough for the current refueling cycle.  After that it will begin to displace coal and gas fired power as summer approaches.  Over the past 28 days, outages have been roughly identical to 2013.  
Nuclear Power Report


Monday, April 14, 2014

Cooling Demand

US cooling requirements for the current week (through Saturday) are forecast by NOAA to be near normal at 8 CDD.  CDD's were much higher last year at 13.

From a natural gas demand perspective, the states that typically burn the most gas to support air conditioning demand in summer showed a mixed picture for the current week.  Texas is expecting a below-normal load, while Florida will be much above normal.  California shows no significant cooling load yet, and total electricity demand remains low in the west.


California daily electric generation demand has only been higher than 2013 on 12 days in 2014, including three last week during a brief warming spell.  Overall the electricity demand picture in the west is poor, due in part to the massive distributed solar (residential and commercial rooftop) boom.


It has been a different story in Texas this year with both weather-related demand and baseline demand up vs 2013.


Solar Cycle Activity Jumps in March

Sunspot counts rose in March, a further indication that this solar cycle is aberrant and may not have reached its final peak yet.  The majority of the higher daily counts were concentrated at the beginning of the month of March, and April activity has not hit new highs thusfar.

The most recent 6 solar cycles:


The daily counts this year so far: