Pages

Friday, December 30, 2016

Rig Counts: Oil +2 Gas +3 in Last Week of 2016. Counts Are Now Just About Where 2016 Began.

Another rig count to support the 7 month trend upward in the US.  Oil gains 2 rigs to 525,  and gas up 3 to 132.  Both counts bottomed out in May, with oil rigs showing the more pronounced rebound.  Gas rigs are constrained in the Marcellus and Utica by pipeline capacity, so the rig rebound has been confined to Texas/OK/LA and the DJ basin this year:

Dec 30 Baker Hughes Rig Counts:


US Oil Production Growth Stalls for 3rd Week

Perhaps temporary anomalies are to blame for the third week of declining continental US oil production.  The volume declines are not substantial, but they interrupt what was a sharp two-month growth trend that saw output rise from 8.45 million BOPD to 8.8.

This week's decline of 20 thousand barrels per day came on the heels of a 10K and a 1K decline in daily output for the month of December.  Rising rig counts belie the onset of a longer trend, but the potential for other short term confounding effects (winter weather, year end, holidays) may mean that a return to growth (or not) may not be apparent for a few weeks more.

2016 Continental US Oil Production (thousand BOPD):

Wednesday, December 28, 2016

Western US Hydro Power Generation Remains Above 2015, Offsets Natural Gas Demand

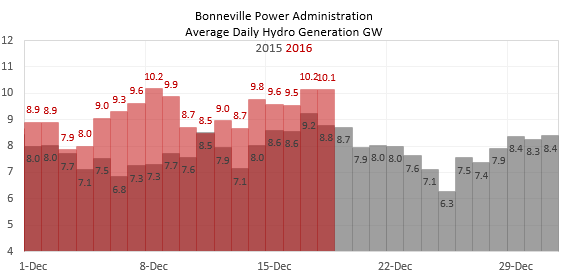
Continued strong precipitation in California and the Pacific Northwest is driving higher electricity output in the BPA and CAISO systems.

Bonneville Power is reporting average hydro output near 10 GW over the last week, that's about 2.5 GW more than the same period last year, which translates to more than 0.5 BCFE of gas equivalent per day.


In California, CAISO hydro output has averaged 2.23 GW this month so far, about 1 GW above last year's 1.25 average for December:

Natural Gas Rapidly Disappearing From MISO Dispatch: Market Share Declines below 20% vs Coal 80%

With holidays suppressing demand, the MISO call on natural gas fired power generation is falling off a cliff.  Coal use continues above 2015 levels, as it has since Dec 1, while gas use has fallen drastically.  For the last 3 days, coal has better than an 80/20 market share against gas:


On an absolute basis, gas use in the last week is down from 4.1 BCFD in 2015 to 2.6 BCFD in 2016, while coal is up from 6.9 to 8.2 BCFED over the same period (based on estimated NG equivalent):  

Tuesday, December 27, 2016

December Weather in Continental US Near Long Term Average, Jan Forecasts COLD

Assuming near term forecasts prove reliable, December will finish with about 878 Gas Utility Weighted Heating Degree Days, which is 19 above the 20 year average:


January forecasts look cold through week 1:

Nuclear Power Generation: Capacity Factor Continues Below 2015 Level by 1.5%

Nuclear power output rose slightly over the last week, to 95.3% of rated capacity today.  Thus it sits 1.5% below 2015 as of December 27th:


The impact, in terms of natural gas demand offset, is roughly 0.3 BCFD, so slightly more natural gas is being consumed than last year, and the difference is likely to be small through the winter, with most refueling complete for the season.  But the difference is meaningful in comparison to November, when 2016 capacity factors were much above 2015, and gas demand was suppressed to the tune of 1 BCFD average for the month:

Southern Power Pool: Natural Gas Market Share Declining

The gas/coal competition in the SPP electricity region is being lost by gas.  Gas had about 35% to coal's 65% in the first half of November, but the rising price of natural gas has driven the gas share down as low as 10% in December:


And this despite rising load, and higher year-on-year load, in December:

Monday, December 26, 2016

Weather Forecast: Extreme Cold Possible Day 11-14

December will end close to normal in terms of gas-weighted HDDs, according to the CPC:


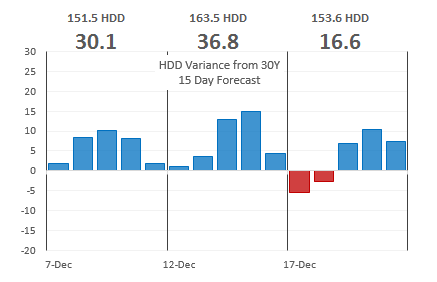
But January 4th begins a period of potentially extreme cold.  It's too far distant to be reliable yet, but it may unsettle markets.  Here is a 15 day forecast based on the GFS model on 12/26 at 12Z:


Hydropower Generation in Western US Strong and Getting Stronger

Heavy precipitation in the Pacific Northwest, and high river and reservoir levels in California, are driving hydroelectric generation at >3.5 GW above last year.  

In the Northwest, the Bonneville Power Admin reports daily averages of as much as 10.4 GW:


And in California, CAISO shows a week of increasing output, with the last two days averaging 2.73 GW, while last year same days were 1.43 GW:

Sunday, December 25, 2016

Gas to Coal Switching: MISO Region Shows Continued Loss of Natural Gas Market Share

Natural gas is losing ground to coal in the midwest.  In the MISO region, gas had 35-40% of carbon fuel power generation market in early November, and coal the remaining 60-65%.  In mid December, that 35-40% has fallen into the 20%'s, despite much higher system load than last year.  And in 2015, gas market share was rising into December, from about 30% (Nov '15) to 35-40% in December.


Here is the daily load profile for both years, showing that the current month is averaging 1,762 GWHD, against last year's December average of 1,641.


Saturday, December 24, 2016

Solar Power Generation in Texas: Starting Small But Watch Out

Utility scale solar power generation in the lone star state is just beginning to register on the dashboard.
Here's the hourly generation profile as reported by ERCOT, for the last six weeks.  Peak output over the period is about 450 MW:


The natural gas equivalent of that generation, roughly speaking, has been between 0.7 and 0.22 BCF for an entire EIA week, as shown below.  That doesn't sound like much, but with significant capacity additions in the works, and the example of ERCOT wind generation, the potential is there to grow significantly and quickly.  And while solar and natural gas fired power are considered good marriage partners, it isn't a marriage of equals.  Solar takes the prime cut of daily power generation during the summer.


Friday, December 23, 2016

Pemex Oil and Gas Production Continues Its Slow Collapse in November

Mexico seems to have accepted the terminal decline curve of its developed oil and gas resources, as liquids output fell for the 5th month, this time by 31,000 barrels per day, to a new low of 2.072 MMBOEPD.  Output fell for every type of crude, and in every region.  


Baker Hughes Rig Counts: Increases in Oil (+13) and Gas (+3)

Oil rig counts continued to rise this week (ended Dec 23), gaining 13 rigs from 510 to 523, with most of those new rigs in Texas and Oklahoma.  It seems to confirm that oil in the mid $50's is profitable for many E&P's.  With the declines in domestic production reversed, it suggests that both rig counts and production will continue to climb in this price environment.


The gas rig count is telling a similar story, up 3 this week to 129, more than 50% above the lows in May:

Nuclear Power Output Falls Below 2015

More reactors are out of service now than in 2015, and for the first time in months the capacity factor has dropped below last year at this time.  As of today, the fleet is at 94% of capacity.  Last year, it was 2.2% higher.


The difference between last year and this year, in terms of natural gas equivalent, is about 0.43 BCFD.  While that may not seem like much, it is significantly more that we saw in November, when it averaged a -1.26 BCFD, for a 38 BCF monthly total DIFFERENCE.  That had a big impact on gas demand, and the tables are now turned:


Weather Forecast: Transitioning from Hot to Cold Over 15 Day Outlook

A colder January is being anticipated.  The Climate Prediction Center is currently showing a gas-weighted December coming it at about the 20 year average, and the Deltix 15 day outlook, based on the GFS model, shows the nation cooling steadily.  Natural gas is responding with strong pricing through the balance of winter.

The CPC, gas-utility weighted, shows the warmth anticipated through the 28th:


Such a forecast would put us 55 HDD's short of the December average of 859, through the 28th, with three days remaining, so we should finish between 850-880 for the month:

Wednesday, December 21, 2016

Alberta Natural Gas Production Returning to Normal, Storage Withdrawals Ease

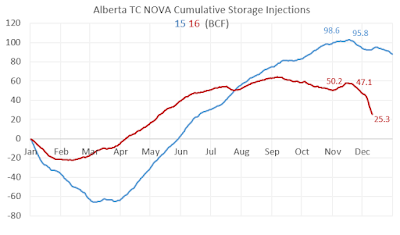
Coinciding with the recent cold snap, TC Nova's natural gas storage withdrawals spiked, and production crashed.  Both conditions have abated over the last few days.

Production was just under 11 BCF yesterday, after falling below 10 BCF last week.  It should return to a potential of 11.3 BCFD or higher if no other weather related events prevent it.  Last December averaged 11.2 BCFD, and this December it has been 10.6 month-to-date.


Reported storage injection and withdrawal activity for the calendar year on the TC Nova system shows that last year, a net 86 BCF was injected, while this year, it currently stands at just 8.9 BCF, with twelve days remaining in the month and year:

Tuesday, December 20, 2016

Haynesville Shale Natural Gas Production Status

A review of reported production to the state of Louisiana for the parishes that contain the Haynesville Shale suggest that production could be rebounding slightly.  There is a significant lag in reporting monthly production for some producers, so September 2016 production is still incomplete.  If the remaining producers report in the next 30 days (they should), and the incremental production from those unreported wells adds up to 0.2 BCFD, that would give us 3 months of higher year-on-year production, probably the beginnings of a bona fide indication of growth:


The largest contributors to production are DeSoto Parish and Caddo Parish:

Monday, December 19, 2016

Weather Forecast: Warmer With Each Model Run

The 15 day outlook is getting ugly for natural gas demand.  Tonight's 0Z run strips out more than 70 HDD's from normal, and takes us from today's extreme low temps to balmy on the 29th, when HDD's bottom out at just 13.1.  Another 12 hours will help verify those extreme oscillations, and for now gas prices are not reacting.


Pacific Northwest Hydroelectric Generation Rises with Load

Hydroelectric power output in the northwest continues at elevated levels, which conveniently coincide with heavy power loads due to the cold snap.  Since December 1, hydro output has exceeded last year by an average of 1.3 GW (9.2 GW vs 7.9 GW).  


During that same period, Load has exceeded 2015 by 0.8 GW (7.7 GW vs 6.9 GW):

Baker Hughes Rig Counts: US Oil Rigs Up Another 12, Gas Up 1


The May 2016 low of 316 oil rigs marked the beginning of a steady march back to the oil patch, though the count is still 31 rigs below this date last year.  The improvements in drilling and completion technology in the meantime suggests that the current drilling capabilities exceed 2015 by a growing margin.  Most of this week's rigs were added in the Permian, which continues to show itself the prime basin for shale drillers.  

Gas rig counts also gained one, and the fleet is now over 50% larger than the low point of 81 seen in May.  Forward prices indicate that the count should continue to strengthen, and 2017 pipeline expansions in the northeast should enable that trend in the Marcellus/Utica to manifest eventually as well.


Meanwhile in Canada, enthusiasm for both oil and gas development is unabated.  As we approach the seasonal drilling peak in Jan/Feb, both oil and gas activity should outpace 2016.  This week Canada dropped one net oil rig but at 116 rigs it remained above last year's 71 by a large percentage.  Gas rigs added another 4, to 116, and is near parity with US gas rig counts!!!  What kind of production will that translate into in 2017+?

US Nuclear Power Output Falls Below 2015


A few reactor units began powering up over the weekend (Oyster Creek, Arkansas Nuclear 1), but a few units also reduced capacity (Pilgrim, Columbia Generating Station), which netted out to a decline in output from Friday by about 0.5%.  


As of today, the natural gas replacement value of outages in 2016 is greater (by 0.01 BCFD) than 2015, and that difference will likely grow over the next week.  

Sunday, December 18, 2016

Weather Forecast: Moderate Heating Demand After 12/19 Extreme Cold

The CPC has lowered their 7 day forecast, but tomorrow will still stand out as extremely cold nationwide, and colder than any day last winter.  Here are the Climate Prediction Center historicals for winter thusfar, plus their current 7 day forecast as of 12/18:


Meanwhile, private forecasts from Deltix through Jan 2 show similar daily numbers, with near normal values beyond the 7 day period:

ERCOT Wind Generation Just Misses New Record

ERCOT narrowly missed setting a new record for wind generation yesterday, hitting an hourly peak of 14,912 MW.  On Nov 27th, the all time record was set at 14,951 MW.

Nonetheless, a tremendous amount of wind power was generated over the recent two day interval, as the area chart indicates.


Friday, December 16, 2016

New Wind Power Record on Deck in Texas (ERCOT)

Tonight about midnight central time, Texas is projecting 15 GW of wind output:


This will break the existing record of about 14 GW, and at a time when system load is projected at just 32 GW:

Nuclear Power Output Shrinks

Nuclear reactor status declined slightly today, prolonging the return from maintenance and refueling that has advantaged this power source thus far.  Today's output displaces 0.6 BCF of gas equivalent more than the same day last year:


Thursday, December 15, 2016

Gas to Coal Switching Continues in MISO Region During Cold Snap

A week of colder than normal temperatures in the MISO region that drove electricity demand above normal in December made little difference to the declining market share of natural gas.

Total load has been elevated vs last month and last year:


Meanwhile gas-fired generation has declined vs last month and last year:

EIA Weekly Natural Gas Storage Report: Surprise 147 BCF Withdrawal

Gas jumped this morning on the release of the EIA storage report, with 147 BCF withdrawn in the week ended December 9th.  But simultaneous weaker weather forecasts put downward pressure on prices, so the initial reaction to the 20 BCF surprise was short lived.


Wednesday, December 14, 2016

Nuclear Power Generation Status: Fleet at 94.2% of Capacity

The US nuclear power reactor fleet is winding up the autumn refueling and maintenance cycle, and uptime improved to 94.2%, as the power source continues to outperform 2015 in NOV-DEC.  Last year the capacity factor stood at 89.9%, which translates to an additional 0.82 BCFD of natural gas replaced in '16 vs '15.

The higher uptime in November translated to a theoretical 37 BCF of additional natural gas replacement, and 7.8 BCF in December to date (through the 14th).  

In 5 or 6 days, the capacity factor should be comparable to last year as it approaches the high 90's before Christmas.  


EIA Weekly Petroleum Status Report: Spike in Production, Drop in Imports and Demand

Today's EIA Report showed a drop in Crude Inventories (down 2.563 MMBBL), a sharp rise in Lower 48 Production (up 101 KBBL), and a dive in net imports (just 3.6 MMBBL).  The 4 week moving average of gasoline demand also fell, continuing the downward trend and below 2015 levels.

See 11 graphs below:


Tuesday, December 13, 2016

2016-17 Winter Comparison to Normal and 2015-16

With the forecast for the remainder of December significantly above normal, a review of the winter thus far shows that we are about 200 Heating Degree Days below normal to date.  The current 15-day forecast indicates that the US will make up about 60 of the HDD deficit by year end.

Monday, December 12, 2016

ERCOT Fuel Mix November 2016: Gas and Coal Fighting It Out

ERCOT released the November Demand and Energy Report today, which shows gas ceding more market share to coal, during a month of near average total load.

Load was up about 2% from last November, averaging 34 GW:


Meanwhile gas-fired output fell 16.5% from 14.89 GW to 12.44 GW:


California Hydropower Generation Falling, Renewable Output Down Overall

Improved hydrological conditions in California this year resulted in excess power generation over 2015, but the margin of improvement is shrinking now as winter approaches, and December has seen hydro output fall faster than it did last year.

In November, average hydro generation in the CAISO region was up more than 1 GW, or double, the 2015 level.  In December however, output has fallen slightly while it improved last year, so the difference has declined by more than 20%, to an 800 MW surplus.  


Both wind and solar output have also fallen off faster, resulting in less renewable output overall.  Solar is averaging 1.49 GW in December, down about 20% from November, though up 28% on 2015 due to increased capacity.


And Wind has averaged 967 MW in December, though last December averaged 1,295 MW for the full month.


Alberta Gas Storage Shrinks to Feed Weather Demand in Canada and US


TC Nova's Alberta gas storage has fallen by about 3 BCFD for the past six days as cold weather descended into North America.  Those daily storage draws are comparable to the largest single day withdrawal of the entire previous winter, and storage has fallen by 22 BCF in December alone.


Sunday, December 11, 2016

15 Day Weather Forecast: Reversal from Cold to Warm

Today's 12Z GFS Model continues the warming trend in the 15 day outlook since close of market on Friday, with net HDD anomaly now showing negative for the period.  All the warmth is in the final 15 day period:


Friday, December 9, 2016

Baker Hughes Rig Counts: US and Canadian Rig Counts Spike

US oil and gas rig counts swelled in the first full week after the thanksgiving holidays, with oil rigs up 21 rigs (mostly in the Permian/Eagle Ford in Texas), and gas rigs up 6 (Marcellus and Granite Wash each adding 2 rigs).  


Weather Forecast: Reduced Demand

The 12Z forecast this morning has extreme cold isolated in the 6-10 day range, though that period is still extraordinarily cold.  It could test the susceptibility of northern US natural gas production to freeze-offs, as it already seems to be impacting western Canada.


Thursday, December 8, 2016

Texas Reports Nov Oil and Gas Drilling and Permit Activity: Well Completions Decline

The Texas Railroad Commission issued its Drilling and Completion Report for November today, and it showed reduced completions for both oil and gas, with oil at a new cycle low of 264 wells completed.  Gas well completions were also low, despite being six months into a price recovery.  Henry Hub front month averaged $2.88 in November, and WTI was $45.71.


Texas Natural Gas Completions

EIA Natural Gas Storage Report: 42 BCF Draw

Today marks the end of the weather-driven small gas withdrawals, at -42 BCF.  The next three weeks will force a re-scaling of this graph, as triple digit withdrawals are guaranteed.  

Today's number was slightly bullish against expectations, but weather models were simultaneously returning more mild December forecasts, so gas prices declined.


Nuclear Power Output Approaching Parity with 2015


Natural gas consumption has been offset by higher nuclear power output during this shoulder season, but that offset is gradually fading.  As of today, output is at 93.7% of capacity, against 90.3% last year.

Impact of Gas to Coal Switching in MISO

A few more days of data, under normal weather conditions (also similar to 2015) help quantify the switch back to coal in MISO region.  Month-to-date gas consumption is down about 1 BCFD, a very significant decline considering the '15 average was 4.3 BCFD, and the'16 average is just 3.4 BCFD, a 21% decline.


Weather Forecast: Impossibly Cold

Today's 6Z 15 day forecast shows some speculatively cold 11-15 day estimates that would be fantastically cold in the northern half of the US, much colder than anything seen in years.  If these came to pass, this winter's entire warm anomaly would be offset in two short weeks.  A couple more runs should either reverse this or generate some genuine concern.  So far markets are not reacting much to these numbers, so there are likely competing outlooks on the last half of this forecast.  However, day 8 of the forecast is getting within range of probable, and that would be a notably cold day.


Wednesday, December 7, 2016

2016 US Solar Power Plant Capacity Additions

From EIA, about 3.7 GW in total, so far this year.


Moderating Forecast

Gas fell steadily this afternoon, as the heating requirements for the upcoming 15 day period were reduced substantially.  The current 18Z outlook is for less cooling on the back end of the forecast, with a big peak on the 15th of December:


Weather Related Electricity Demand

When comparing this winter to last winter, and to normal winter, gas utility demand is not the full story.  A normal winter this year will generate significantly more electric power demand, which will help offset the market share that gas gives up to coal.  Here's a look at Jan-Feb in the ERCOT region.  It is a scatter plot of 2015 vs 2016.  The poly line equation is similar, but 2016 didn't have any cold days, only 1 above 25 HDDs so it's a shorter, flatter line.  

These two periods differ by an average of 4.5 HDDs daily, which is this case equates to an incremental 2.6 GW of average load.  That has a gas replacement value of about 0.6 BCFD.  That's significant across the CONUS, and would have a big impact on power burn this year if weather approximated normal.  


US Gasoline Demand

Today's EIA Petroleum Status Weekly Report added concern about declining activity, with gasoline demand falling to a new seasonal low, and below last year's lowest fall/winter weekly report.  Among the possible explanations, weather isn't one of them.  Perhaps the election.  In any case, this is likely to spell the end of the steady recovery in highway miles that has characterized the post-recession era.