Most basically, we have two of the three variables needed to estimate developed reserves, and from that, production:
- Working Rig Count
- Rig Productivity (wells per rig)
- Reserves per Well
What did the Baker Hughes data show, and not show?
It shed no light on one large problem, that of well classification. The data is provided by basin, but without and oil/gas breakout. We are a few years into a collapsing gas rig count and a spiking oil rig count, so basins that have an oil, dry gas, and wet gas window cannot be easily analyzed from this data.
It does show average rig counts, and total well spuds, by basin. The data is by calendar quarter, and begins in Q1 2012, so there are 6 quarters of complete data.
Even where the rig productivity data isn't clean or doesn't pass the common sense test, the well spud count itself is useful. Here are the well spuds for the most recent quarter, Q2 2013:
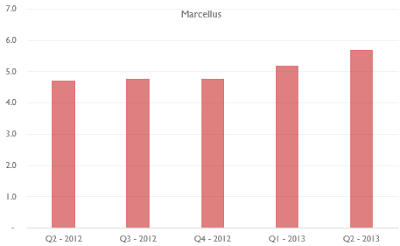
Rig productivity is clearly improving, but the data show rates of efficiency and implied drill times that are much lower than the best-in-class operators are reporting publicly. Here are the well spuds per rig in a few well known basins:
The lesson from history is that the best operators continue to improve, and the worst operators improve more (if they live), so it appears there is substantial room for improvement in these plays. The younger plays also improve more, due to the steeper slope of the learning curve, and the decreasing need to devote rigs to R&D science projects.
In particular consider the Haynesville. The most recent quarter indicates 3 well spuds per rig, thus an implied 30 day spud-to-spud time. Q2 2012 spuds were 1.8, and implied 50 days per well. The rigs left this play quickly in 2011, and then stabilized, currently at 42. Per Baker Hughes Rig Count......
If we guess that the wells being drilled have a 6 BCF ultimate recovery potential, we could say that:
42 rigs x 30 days per well x 6BCF per well = 250 BCF per month of developed resource. Over time, the developed resource would approximate the production level, and 250 BCF per month is 8.3 BCF per day. Of course there are nuances and important other factors that make this a theoretical maximum only, but it demonstrates that a few dozen rigs can accomplish a lot in an environment where all 3 variables are constantly improving.


