Natural gas price forecasts issued by investment banks and other analysts hinge principally on accurate estimates of domestic production and on gas demand for power generation.
Projecting natural gas used in power generation has proven difficult in recent years, and at present the published estimates vary widely. That seems to stem from the many independent variables that go into the calculation:
Aggregate Load
Total electric power consumption in the US has stopped growing since the recession. This has surprised many, and several explanations have been offered. Still, most analysts and the power generation industry itself expects growth to resume.
Mix of Generation Assets
Retirement of aging assets (mostly coal fired) has been sporadic and regulation-driven. A significant amount of coal fired capacity is scheduled to be retired in '14-15, but those assets are typically operating at low capacity factors now. New gas-fired generators are steadily coming on line, but also can operate at low capacity factors. Renewables (wind and solar) are also being rapidly added.
Price Elasticity
This is the biggest single factor. Many utilities and independent power producers are capable of switching between coal and gas rapidly. The low gas prices of 2012 resulted in gas replacing coal at levels that surprised even the more optimistic forecasters, soaking up huge volumes of excess natural gas. Now that gas prices are closer to 'normal' in the $4.50 range, the question is how much gas marketshare will be ceded back to coal (which has also seen an increase in price).
State by State
A look at how natural gas used for power generation has been trending in individual states might provide a more granular perspective. In some cases it seems to clearly show that certain states have been building out gas fired capacity which has resulted in market share gains for gas that look less price sensitive.
North Carolina appears to be an example of this. Here is the daily gas demand, by month since 2007, with Decembers highlighted. It shows a clear rising trend where 2012 is not a significant aberration.

Texas, on the other hand, is a large gas consumer but also a coal producer, and the leader in wind power capacity nationally. It also has begun to experience aggregate load growth in the past year. It shows a large but steadier demand for gas fired power. It is very weather sensitive, and the recent December was very cold, which at least partially explains the record demand.

Florida is different. It uses a lot of gas but it somewhat pipeline constrained, and has big summer peaks. No significant growth trend can be observed in the last three years:

Georgia has been adding gas fired capacity for some time:

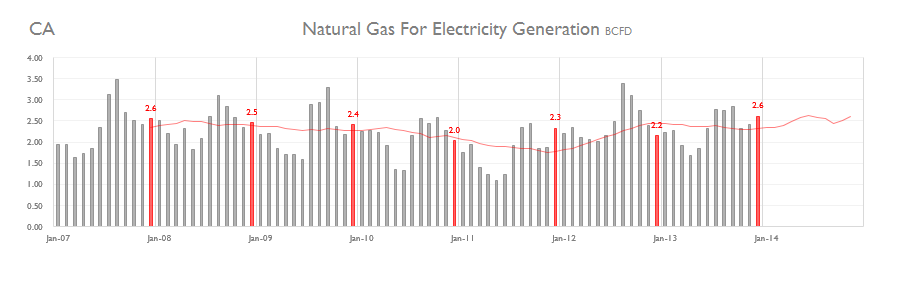
California shut down the last of the two San Onofre nuclear reactors in Jan 2012. That was probably worth about 300 MMCFD in incremental gas demand. But power demand isn't growing in California, and renewable capacity is expanding rapidly. Still, gas load is running well above 2011 levels.