The EIA released the monthly data for July 2013 today, with few surprises. The electrical and industrial demand numbers were as follows:
Electrical generation demand was well below 2012, but only 1 BCFD below July 2011, despite far fewer cooling degree days.
NOAA's climate prediction center records these CDD counts for the last 3 years:
July 2011: +411
July 2012: +408
July 2013: +351
Monday, September 30, 2013
Friday, September 27, 2013
Canadian Natural Gas Drilling Activity Up
Canadian natural gas drilling activity trends have been diverging noticeably from the US. With today's US rig count down a steep 10 rigs to 374 gas rigs, near the 3 year low, the Canadian NG rig count rose 13 to 158, near a 3 year seasonal high:
Should we look for an increase in output from the north? Perhaps, although the rig fleet has only recently begun the ramp up, so we may see nothing for some time. Precision Drilling (PDS) is dominant in the canadian drilling market, and their most recent comments were positive, including an expectation that more rigs will soon be working to delineate the northern BC/AB shale gas plays in preparation for LNG export.
Tuesday, September 24, 2013
Texas Drilling Permits and Completions
As previously discussed, Texas publishes a helpful monthly summary of drilling permits and well completions. The catch is that there are three types of permits and only two types of completions. Permits can be for oil, gas, or oil+gas. Completions are classified as either gas or oil.
Here is a statewide look at the permit history and the completion history, with monthly data and a 3 month moving average line:
Here is a statewide look at the permit history and the completion history, with monthly data and a 3 month moving average line:
Tuesday, September 17, 2013
Texas Production and Drilling Trends
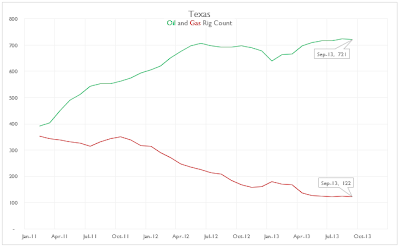
Texas remains the epicenter of oil and gas activity in the US. About half the 1,700+ active rigs in the nation are working there. But the rig mix is changing significantly. From about even three years ago, oil rigs now outnumber gas about 6 to 1:
The Texas Railroad Commission collects and reports oil and gas statistics, but their data is not close to finalized for many months, so recent production is typically understated. This has let some to wrongly conclude that production is in decline. The EIA uses a methodology for estimating unreported production, and their data is less subject to revision and more accurate for recent periods. Here is the monthly history since 2010 of the EIA data vs. the TX RRC data for natural gas production. Over time, the RRC number has averaged about 0.2 BCFD below the EIA estimate. But look at the current period:
The Texas Railroad Commission collects and reports oil and gas statistics, but their data is not close to finalized for many months, so recent production is typically understated. This has let some to wrongly conclude that production is in decline. The EIA uses a methodology for estimating unreported production, and their data is less subject to revision and more accurate for recent periods. Here is the monthly history since 2010 of the EIA data vs. the TX RRC data for natural gas production. Over time, the RRC number has averaged about 0.2 BCFD below the EIA estimate. But look at the current period:
So it seems that unless a new source of error has crept in, the RRC data is not reliable for close to a year.
It can be difficult to accurately assess oil vs gas activity levels in Texas, part because drilling permits can be one of three types:
- Oil
- Gas
- Oil & Gas
But well completions are classified as either oil or gas, not both. When a well completion is considered an oil completion, the production therefrom is classed as "Oil" and "Casinghead Gas". A gas well completion has production classified as "Gas Well Gas" and "Condensate".
To look strictly at oil wells, we see that the amount of casinghead gas produced with the oil has maintained a steady percentage as oil production has grown. Here is the %, on a BTU basis, of casinghead gas produced from oil wells 2010 to present:
This is a high associated gas content. It implies that even with a low gas rig count, a significant volume of natural gas will be produced as Texas oil production continues to rise.
Now total liquids is another point worth making. Here is how the RRC reports it, separating oil and condensate. (There is some discussion about the classification of the liquids coming out of the Eagle Ford.)
Monday, September 16, 2013
Rig Count Classifications
US rig counts have been under scrutiny as reliable predictors of future production for two reasons:
- Classification of the rig, like the drilling permit itself, is at the driller's discretion in many cases. And drillers are motivated to find more liquids and less gas, and convince investors that they are doing so.
- Drilling targets contain meaningful amounts of both oil and gas, more so than in the past.
- Production results don't seem to be well correlated to rig counts.
This issue has been widely reported, but not quantified. Here is an example that is more than anecdotal, and it gives some insight into what is really going on.
I looked for an example that had these characteristics:
- Both oil and gas targets
- Both oil and gas rig counts
- Good data
- A basin where gas and oil were found together in the zones being targeted.
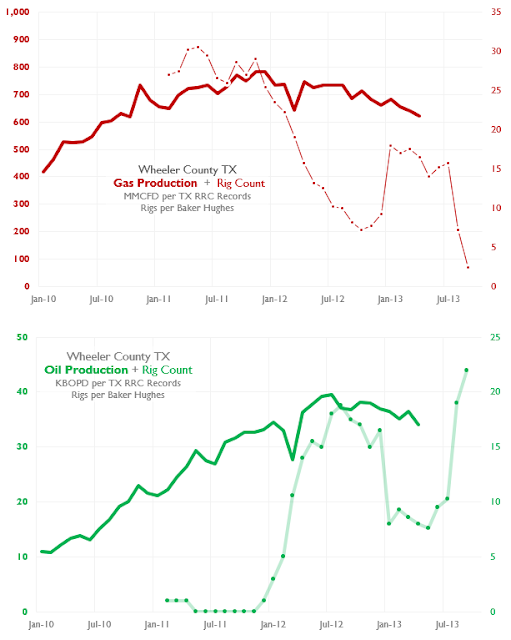
I picked the epicenter of the Granite Wash, Wheeler County Texas. Here are the basics. (Oil includes condensate.)
Some initial observations:
- Rig counts are very current (through Sep 13), but production goes only through April. Some production is reported through June, but it is likely not a complete account, so there is the lag is reporting, plus the obvious lag between drilling and production.
- Drill times are averaging around 25-30 days overall in the Granite Wash.
- Oil rig counts were zero or thereabouts for nearly all of 2011, yet oil production steadily grew from about 21 KBOPD to 34.
- In January 2013, an abrupt reclassification of 8-10 rigs took place, from gas to oil.
From a BTU standpoint, Wheeler still produces about 3x as much gas as oil, but gas has been in apparent decline since Jan '12, and oil is trailing off but less so. There may be gas takeaway constraints in this area, but that would not explain a decline in gas production, unless dry gas was in decline and wet gas production was increasing.
Chesapeake produces almost half the oil in the county, so their own rig classification and production history will explain this in further detail.
Wednesday, September 11, 2013
Shale Gas: The Future is Low Gas Prices and Overproduction
Shale gas math has proven hard for producers, consumers, and investors to accept. Resource scarcity was the reigning paradigm, and the rules were:
- Hydrocarbons getting harder to find
- Each well costs more (inflation, deeper/remote drilling)
- Each well finds less (infill drilling, downspacing, weaker prospects, depleted fields)
The shale revolution came, but it didn't seem sufficient to offset production declines because:
- Decline rates were high
- Prospects were few (for a long time just the Barnett and Fayetteville)
- Wells were expensive
But production grew, and grew. New reserves were found onshore. Technology advanced, costs came down. So gas prices came down to the point that demand was elastic by competing with coal.
But whether it is the human tendency to anchor on the status quo, or to doubt revolutionary claims, or something else, the situation is setting up again for natural gas. Old metrics die hard, and the legacy cost structures and productivity seem to be blinding us to the (increasingly) obvious.
Exhibit A: Shale basins and rig productivity, from Baker Hughes Q2 2013:
Consider the best known basins now, the Marcellus and Utica. 608 wells were drilled in these two plays in Q2, and rigs were averaging a little less than 2 wells per month, so an average of 113 rigs were working, about 30% of the gas rig fleet.
What is the average well going to produce? This is an important question. The Utica is perhaps a little early to set a type curve on, with about 500 wells drilled and only about 125 producing. But the early wells are also typically improved upon over time, and the best wells to date were drilled by Antero Resources, delivering what are frankly mind-boggling flow rates, around 8-10,000 BOE per day, much better than the best Marcellus wells.
On the Marcellus side, there are 3 or 4 well types at this point:
- Dry Northeast
- Dry Southwest
- Rich Southwest
- Super-Rich Southwest
These wells are generating 4 -15 BCF reserve estimates per well (dry gas only). The drilling is moving to the wetter regions, but still plenty of dry gas wells being drilled, and obviously the ability to migrate rigs quickly should gas prices perk up.
Here then is the basic truth:
200 wells per month, at 5 BCF dry gas reserve estimates = 1 Trillion cubic feet developed per month. At that constant development rate, production would peak at over 30 BCFD, multiples of what is being produced now. And wells are going down faster, cheaper, and finding more gas as these plays develop and operators improve completion techniques.
There is also a lot of undeveloped acreage, so prime drilling locations will not deplete quickly.
We are using the best play as the example, granted. But the data is lagging, and operators are projecting better results going forward. There are so many other upside risks to this, including stacked pay: The Upper Devonian is above the Marcellus, and early results are looking great. This can multiply reserves very quickly, and take advantage of existing infrastructure.
We could go through a similar exercise for the Eagle Ford, where drill times are much faster and the rig fleet is double that of the Marcellus/Utica (including oil rigs). The dry gas area of the Eagle Ford is being neglected now in favor of liquids to the north, but the reserves have been proved, and the locations are there when prices justify it and bottlenecks are cleared.
What is going to happen? Gas demand will steadily and noticeably rise due to electricity generation, industrial use, and finally LNG export. But the many BCFs these sources will eventually consume will not overwhelm production capacity, even at very low prices. The dreams of $5 gas are very very far off. Another expected outcome is a reduction in price volatility based on low gas inventory. If anything, the volatility will come when demand evaporates (unseasonable weather for example), and there is nowhere to put the produced gas. A few of these events seem inevitable.
Monday, September 2, 2013
Eagle Ford Natural Gas Production
Texas currently produces almost 30% of the nation's marketed natural gas, about 20 BCFD. The state's overall output has been relatively steady for the last three years, though activity has fluctuated substantially from basin to basin. The Barnett and Haynesville have been in noticeable decline.
The Eagle Ford is one area where production has been growing quickly. But rigs have been steadily moving from the dry to the wet side of the play. Transportation constraints are a factor as well, and gas has a harder time getting out of the basin. Here is what the Texas RRC reports for gross production by month from the major counties in the play. Note that Liquids = Crude and Condensate, not NGLs. NGLs are still in the gas stream at the well head:
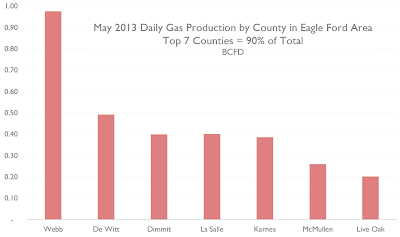
90% of the natural gas is produced in 7 counties, with Webb producing the lion's share. At May 2013, here is the relative contribution:
Gas production from the EF will look as though it is growing year-over-year at the end of 2013, but the slope is currently negative, and gas rig counts are down to a meager 37 (up from a 3 year low of 23):
The drilling results from the wetter regions have wide ranging GORs, but the coveted acreage can produce over 90% liquids, so it is unclear whether associated gas will make a major contribution going forward.
Dry gas reserves on the other hand are ample, so a price signal and pipeline should bring the rigs back quickly. Drill times in the EF are much faster than Haynesville or Marcellus, so a small rig count can be deceiving. The best in class wells are drilling around 10 days to TD now, and that will undoubtedly improve. A crude model of potential production looks a little like this:
37 Rigs @ 2 wells per month x 5 BCF per well = 370 BCF developed per month. At that constant drilling rate, production would asymptotically approach 12 BCFD (370 BCF per month / 30 days). So that's still impressive. The Haynesville has about the same rig count, but wells take about twice as long to drill, and have a similar EUR of 5-6 BCF.
The Eagle Ford is one area where production has been growing quickly. But rigs have been steadily moving from the dry to the wet side of the play. Transportation constraints are a factor as well, and gas has a harder time getting out of the basin. Here is what the Texas RRC reports for gross production by month from the major counties in the play. Note that Liquids = Crude and Condensate, not NGLs. NGLs are still in the gas stream at the well head:
90% of the natural gas is produced in 7 counties, with Webb producing the lion's share. At May 2013, here is the relative contribution:
The drilling results from the wetter regions have wide ranging GORs, but the coveted acreage can produce over 90% liquids, so it is unclear whether associated gas will make a major contribution going forward.
Dry gas reserves on the other hand are ample, so a price signal and pipeline should bring the rigs back quickly. Drill times in the EF are much faster than Haynesville or Marcellus, so a small rig count can be deceiving. The best in class wells are drilling around 10 days to TD now, and that will undoubtedly improve. A crude model of potential production looks a little like this:
37 Rigs @ 2 wells per month x 5 BCF per well = 370 BCF developed per month. At that constant drilling rate, production would asymptotically approach 12 BCFD (370 BCF per month / 30 days). So that's still impressive. The Haynesville has about the same rig count, but wells take about twice as long to drill, and have a similar EUR of 5-6 BCF.
Subscribe to:
Comments (Atom)


