PJM is the largest ISO region in terms of gas fired power demand. Gas output has continued to rise vs. coal, and in May the YOY comparisons show a gas-vs-coal elasticity curve that is shifted up, but with a lower slope than May 2018. This suggests that the higher system loads of summer may compress the significant gains in market share for gas. No real heat has tested the edge case of the equation yet.
Thursday, May 30, 2019
Wednesday, May 29, 2019
Residential Electricity Demand: Steadily Declining Per Capita
The EIA breaks out electricity demand into 3 main sectors (Commercial, Industrial, Residential).
Only residential has a steadily growing customer count, growing at a slightly lower rate than the US population. Nevertheless, the customer count is growing faster than power demand growth, indicating a steadily decreasing demand per customer.
This could be an efficiency story, and urbanization story, or something else. And the magnitude is small, but still negative. And it's the most positive demand sector.
Monday, May 27, 2019
Pemex April Production: Oil Declines on Trend, Gas Output Plateaus
Pemex reported oil and gas production for April, showing crude output declining by 15K BOPD from March, and gas down 41MMCFD.
Regionally, oil declines were entirely offshore, with southern onshore output flat, and output rising slightly in the terrestrial north:
Gas output was flat regionally, but nitrogen associated output rose and oil associated NG fell slightly:
Regionally, oil declines were entirely offshore, with southern onshore output flat, and output rising slightly in the terrestrial north:
Gas output was flat regionally, but nitrogen associated output rose and oil associated NG fell slightly:
Friday, May 24, 2019
MISO Region: Coal Re-takes Market Share from Gas, But Gas Still Outperforming 2018
Very briefly, gas overtook coal in late April, but coal-fired power generation has risen against gas since then.
Never the less, on a total carbon demand basis, gas is averaging about 8 points higher than 2018 in May. Unfortunately, total load in the system has been well below the prior year, so we have not seen this curve tested at summer heat loads yet:
Never the less, on a total carbon demand basis, gas is averaging about 8 points higher than 2018 in May. Unfortunately, total load in the system has been well below the prior year, so we have not seen this curve tested at summer heat loads yet:
Thursday, May 23, 2019
US Gasoline Demand Stalling
This week's EIA Petroleum Balance Sheet showed more weakness in Motor Gasoline Product Supplied, with the 4 week average down 1.1% from '18, and the YTD number off by 0.4%.
Dampening some of the weekly noise in the data, here are the 52 and 13 week averages, showing a slight YOY deficit since last Autumn:
Dampening some of the weekly noise in the data, here are the 52 and 13 week averages, showing a slight YOY deficit since last Autumn:
Tuesday, May 21, 2019
Drilling Permit Applications in Texas Still Outpacing Well Completions in April
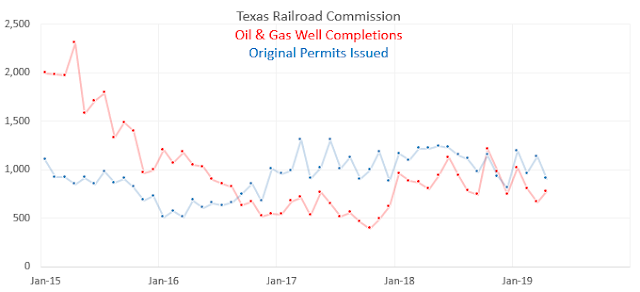
The April Drilling, Completion, and Plugging Report from the Texas Railroad Commission showed permit applications for April at 909 vs 775 wells completed. Permits have been gradually declining since last summer, with significant monthly variability, but still higher than new well completions.
Monday, May 20, 2019
Cooling Loads Rising in Early Summer
A minor heat wave this week should begin to indicate how the increase in base load gas fired generation will translate into summer NG demand. Most forecasts are for power generation demand to exceed 40 BCFD in July and August. EIA is currently at 41:
Weather has been near average since April 1, but CDD's are forecast to rise to around 130% of seasonal norms this week, and the first real heat of the year:
The NCEP historicals and 7 day forecast:
Overall electrical loads have been very low up to now, though gas market share has been up in most regions. Spot prices are up slightly, but comparable to 2018:
Friday, May 17, 2019
Hydro Recovers in the Northwest
Runoff in the Pacific Northwest surged in the last ten days, coincident with an increase in power exports to California.
Thursday, May 16, 2019
Southern Power Pool: Gas Fired Power Up 15-25% Over 2018
Thus far in May, Southern Power Pool reports the gas/coal mix at about 50%, up from last year's 40-45%:
Wednesday, May 15, 2019
Gasoline Demand Flat Year on Year
Domestic gasoline demand, as reported in today's EIA Weekly Petroleum Balance Sheet, was well below last week, bringing the YTD average down below 2018 by 0.3%:
Tuesday, May 14, 2019
California Energy Demand is Tepid Year-to-Date
California (CAISO) electric load has been lagging 2018 thus far in 2019.
Weather demand was higher than '18 through Feb, and then weakened to an average of 2 degree days below prior year until now.
Nevertheless, cooling demand is too low to indicate a meaningful change in the relationship between degree days and demand, since cooling matters much more than heating in California:
Monday, May 13, 2019
EIA Revises Down Natural Gas Supply Projections
In the May 2019 Short Term Energy Outlook, the EIA reduced it's dry gas production estimates for the balance of 2019 and all of 2020. The largest revisions occur in summer and autumn of 2019, where output is seen down about 1 BCFD from the April issue.
Nevertheless, estimates of injection season peak inventories rose slightly for both 2019 and 2020.
Friday, May 10, 2019
ERCOT Air Conditioning: Power Generation per Degree Day in May
Electricity demand growth has been generally robust in Texas for some time now, but the beginning of cooling season is indicating lower power consumption per degree day in May. Eight days of data are not conclusive, but the load requirements are significantly lower than '18 so they are worth watching. The trend line indicates loads down 8% or more through the 8th of May:
Wednesday, May 8, 2019
ERCOT Power: Gas Gains in April, But Carbon Loses
Natural Gas used for power generation in the ERCOT region (most of Texas) gained more market share over coal in April, but carbon based fuels in total (coal+gas) lost market.
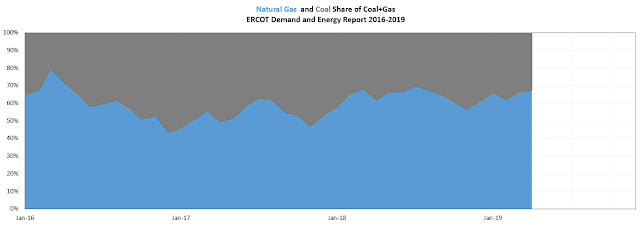
In April, the gas/coal balance rose to 67.6% gas, 32.4% coal. This is an April record, up from 65.9% in March, and up 6.2% over the previous April:
Against that, gas and coal were vying for an ever smaller share of the total power pie, with total carbon generation falling to 59.2% of the total load, a new record low. The main culprits here is wind, which continues to grow faster than total demand, achieving a new record of 9.93 GW of average output in April, which was about 26.7% of the entire power market.
Against that, gas and coal were vying for an ever smaller share of the total power pie, with total carbon generation falling to 59.2% of the total load, a new record low. The main culprits here is wind, which continues to grow faster than total demand, achieving a new record of 9.93 GW of average output in April, which was about 26.7% of the entire power market.
Tuesday, May 7, 2019
Gas Gaining Market Share Over Coal in Southern Power Pool
With total loads steady, and wind output falling over the last two weeks, gas has taken up the slack in SPP, pushing fossil fuel market share well above 50% lately. The current year in red (with a 7 day average line) shows substantial gains on 2018. SPP isn't an especially large consumer of gas however, so large percentage gains translate into less than an incremental 1 BCFD.
Monday, May 6, 2019
Western Canada Natural Gas Production in 2019 Tracking 2018
Western Canada's TC Nova Pipeline System reports daily output comparable to last year. Output briefly fell below trend in February, but quickly recovered. Scheduled maintenance, combined with seasonal drops in rig counts, drove down output in late April and early May, again mirroring 2018.
Friday, May 3, 2019
Gas Rig Counts Continue a 4 Month Downtrend
Today's 3 gas rig decline to 183 reflects a 2 rig drop in the Haynesville and a loss of one in the Marcellus. Counts remain high but clearly on a decline.
In the Marcellus however, at 61 rigs the fleet remains larger than at any time in 2018 or before.
Finally in the Permian, the gas rig count remains at zero of course, while oil rigs are at 459. This tells the story of associated gas....
In the Marcellus however, at 61 rigs the fleet remains larger than at any time in 2018 or before.
Finally in the Permian, the gas rig count remains at zero of course, while oil rigs are at 459. This tells the story of associated gas....
Thursday, May 2, 2019
EIA Natural Gas Inventory Rises 123 BCF
Another large injection (+123 BCF) was reported this week, which reduced the deficit to the 5 year average to -316 BCF. Large early season injections are expected to transition mid-summer to a tighter balance, as exports ramp up. Even so, these spring injections have been larger than expected, and prices reflect that, with the summer strip falling into the $2.60's.
The last four weeks have a total 5-year average injection of 143 BCF, and this year it has totaled 332!
The daily weather anomaly, in Heating Degree Days, is certainly below average, with all but 7 days in the period warmer than normal.
Yet, the period totaled 314 HDD's this year, against a 20 year normal of about 364. That would normally translate into something like 100 BCF in reduced gas demand. Thus, unusual weather explains about half of the excess injections.
Wednesday, May 1, 2019
Unleaded Fuel Consumption: Down on the Week and on the Year
Today's EIA release was a bit disappointing from the demand side. Unleaded fuel supplied is now down 100KBOPD year to date:
Subscribe to:
Comments (Atom)


